Figures & data
Table 1 The Relationship Between TGFB2-OT1 Expression and the Clinicopathological Features of HCC Patients
Figure 1 lncRNA TGFB2-OT1 is highly expressed in hepatocellular carcinoma (HCC) and is associated with a poor prognosis in HCC patients. (A) Data analysis from TCGA database showed that TGFB2-OT1 was highly expressed in the tumor tissues. (B) TGFB2-OT1 was upregulated in 202 HCC tissues when compared with 202 adjacent tissues. (C–D) Kaplan–Meier curves showing the overall survival (OS) and recurrence-free survival (RFS) rates of the TGFB2-OT1 high and TGFB2-OT1 low groups. (E) RT-qPCR for TGFB2-OT1 in HCC cell lines. (F) FISH analysis demonstrating the subcellular localization of TGFB2-OT1 in HCC cells. (G) RT-qPCR analysis for TGFB2-OT1 in the cytoplasmic and nuclear. **P < 0.01; ****P < 0.0001.
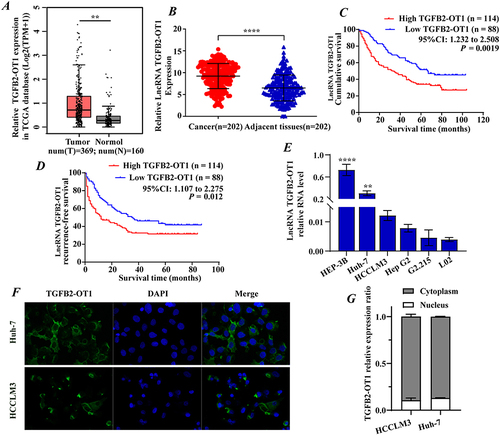
Figure 2 lncRNA TGFB2-OT1 facilitates proliferation, invasion, and migration in vitro and in vivo. (A) EdU assay indicating that the upregulation of TGFB2-OT1 significantly increased the number of EdU-positive hepatoma cells. (B and C) The number of hepatoma cell colonies was increased after TGFB2-OT1 overexpression. (D) Transwell assay demonstrating that TGFB2-OT1 overexpression facilitated tumor cell invasion. (E and F) Wound-healing assay revealing that TGFB2-OT1 overexpression facilitated cell migration. (G) Representative images of xenografts with AV-TGFB2-OT1 overexpression (n=4), AV-Vector (n=4) expression, and saline treatment (n=4) removed from nude mice. (H) Tumor volume curves indicating that TGFB2-OT1 significantly increased the tumor volume of xenografts. (I) Kaplan–Meier curves of survival in nude mice. (J) Tumor weight histogram of the xenografts. (K and L) Representative images of hematoxylin and eosin (HE)-stained lung metastatic tumors. Magnification 200× and 400×. *P < 0.05; **P < 0.01; ***P < 0.001; ****P < 0.0001.
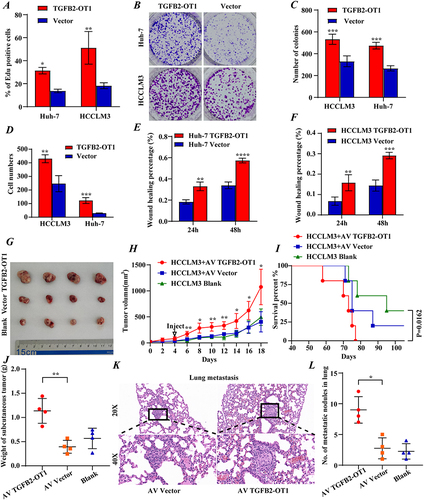
Figure 3 lncRNA TGFB2-OT1 affects angiogenesis in vitro and in vivo in HCC. (A–E) TGFB2-OT1 significantly increased the tube-covered area, total tube length, total branching points, and total loops in HUVECs incubated with CMs. (F) ELISA demonstrated that the concentration of exocrine VEGFA in CMs was significantly increased after TGFB2-OT1 overexpression. (G) Western blot (WB) analysis of VEGFA protein expression in Huh-7 and HCCLM3 cells with or without TGFB2-OT1 overexpression. (H) Xenografts were fixed, embedded in paraffin, and stained for VEGFA, CD31, and CD34. *P < 0.05; **P < 0.01; ***P < 0.001; ****P < 0.0001.
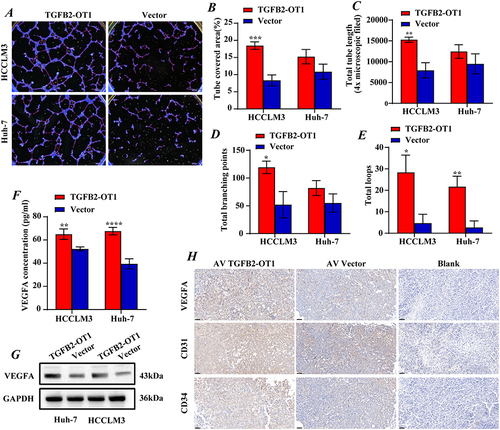
Figure 4 lncRNA TGFB2-OT1 binds to β-catenin and increases intracellular β-catenin protein expression. (A) Agarose electrophoresis of RNA immunoprecipitation (RIP) products after PCR. (B) PCR analysis of RIP products. (C) Representative immunofluorescence images showing the co-localization of TGFB2-OT1 and β-catenin. (D) Representative images of different fragments of TGFB2-OT1. (E) WB analysis of β-catenin in HCCLM3 cells after treatment with RNAs corresponding to different fragments of TGFB2-OT1. (F) WB analysis of β-catenin in Huh-7 and HCCLM3 cells with or without TGFB2-OT1 overexpression. (G) Representative images of immunohistochemical staining (IHC) for β-catenin in xenografts. ****P < 0.0001.
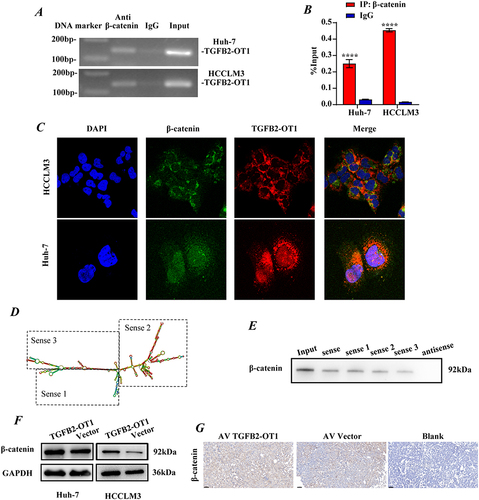
Figure 5 TGFB2-OT1 stabilizes β-catenin by antagonizing the binding between GSK3β and β-catenin. (A) WB analysis of β-catenin expression in Huh-7 and HCCLM3 cells treated with cycloheximide (CHX) for 0, 6, 12, and 18 h. (B) Endogenous ubiquitination assay of β-catenin in Huh-7 and HCCLM3 cells with or without TGFB2-OT1 overexpression. (C) Exogenous ubiquitination assay of β-catenin in Huh-7 and HCCLM3 cells with or without TGFB2-OT1 overexpression. (D) WB analysis of phosphorylated β-catenin expression levels in Huh-7 and HCCLM3 cells with or without TGFB2-OT1 overexpression. (E) WB analysis of phosphorylated β-catenin expression levels in Huh-7 and HCCLM3 cells treated with Calyculin A for 30 min. (F) Co-immunoprecipitation (Co-IP) and WB analysis in Huh-7 cells illustrated that lncRNA TGFB2-OT1 competes with GSK3β for binding to β-catenin.
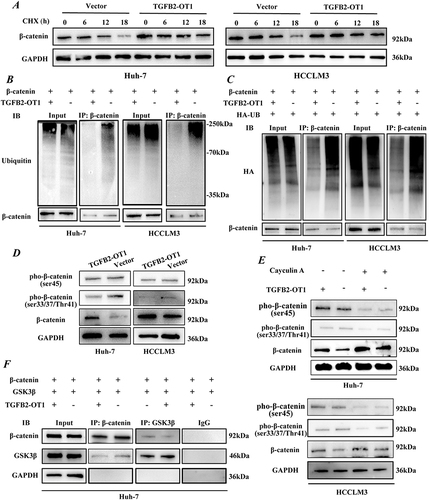
Figure 6 Knockdown of β-catenin reverses the phenotypic effects of lncRNA TGFB2-OT1 on HCC in vitro and in vivo. (A) EdU assays in Huh-7 and HCCLM3 cells transfected with different plasmids. (B and C) Transwell assays indicated that the knockdown of β-catenin reverses the effects of TGFB2-OT1 on hepatoma cells. (D) WB analysis of VEGFA, β-catenin, and phosphorylated β-catenin expression levels in Huh-7 and HCCLM3 cells transfected with different plasmids. (E) ELISA for examining exocrine VEGFA levels in CMs from hepatoma cells. (F and G) Representative images of angiogenesis after incubation with different CMs and related statistical analysis. (H) Representative images of xenografts from nude mice following rescue experiments. (I and J) Tumor volume curves and tumor weight histograms of xenografts from nude mice with tumors treated with different adenovirus constructs. *P < 0.05; **P < 0.01; ***P < 0.001; ****P < 0.0001.
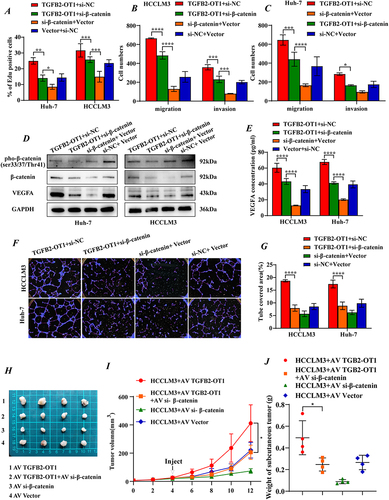
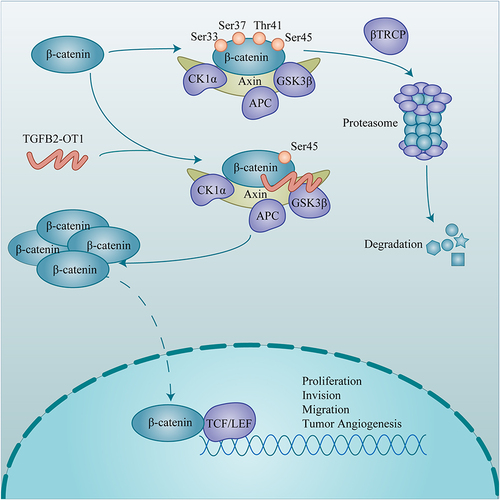
Figure 7 Schematic illustration showing the mechanism through which lncRNA TGFB2-OT1 promotes the progression and angiogenesis of HCC via β-catenin stabilization.