
Figures & data
Table 1 Clinical Characteristics of the Patients
Figure 1 Patient selection flowchart.
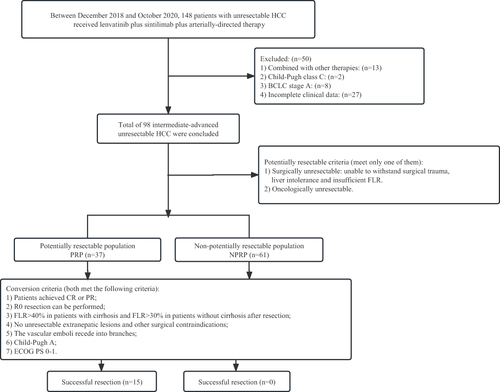
Figure 2 Comparison of survival between the PRP and the NPRP. A. Kaplan–Meier survival curves showing PFS of the PRP and the NPRP. B. Kaplan–Meier survival curves showing OS of the PRP and the NPRP.
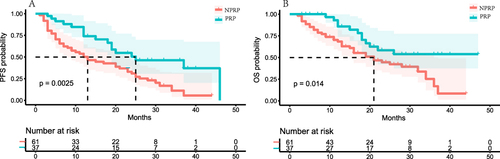
Table 2 Summary of the Best Responses
Figure 3 Best percentage changes in the sizes of the intrahepatic target lesions of patients from baseline assessed with RECIST criterion. (A) Waterfall plot of PRP; (B) Waterfall plot of NPRP.
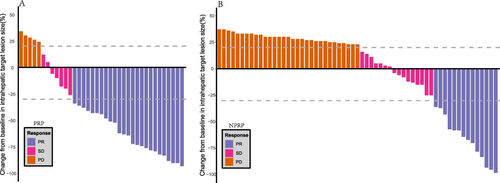
Figure 4 Best percentage changes in the sizes of the intrahepatic target lesions of patients from baseline assessed with mRECIST criterion. (A) Waterfall plot of PRP; (B) Waterfall plot of NPRP.
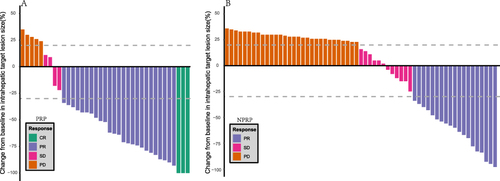
Figure 5 DCE-MRI and pathology of one HCC patient received conversion surgery. The red arrow points to the site of the tumor (A, B, D and E) or MPVTT (C and F). (A) an irregular mass on T2WI. (B) mass with heterogeneous enhancement at arterial phase. (C) MPVTT at venous phase. (D) the tumor was shrunken, the left lobe of the liver was atrophied on T2WI. (E) mass with absence of significant enhancement at arterial phase. (F) tumor thrombus in the MPV was disappeared at venous phase. (G) extensive necrotic tissue (HE, 100×).
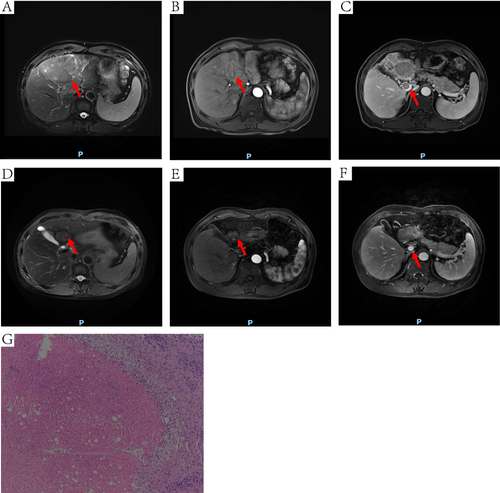
Figure 6 DCE-MRI and pathology of another HCC patient received conversion surgery. The red arrow points to the site of the tumor (A, B, D and E) or MPVTT (C and F). (A) an irregular mass on T2WI (10.4 x 7.3cm). (B) inhomogeneous enhancement of tumor at arterial phase. (C) MPVTT at venous phase. (D) the tumor was shrank on T2WI (6.6 x 4.7cm). (E) the tumor was shrank at arterial phase. (F) tumor thrombus in the MPV was disappeared at venous phase. (G) extensive necrotic tissue (HE, 100×).
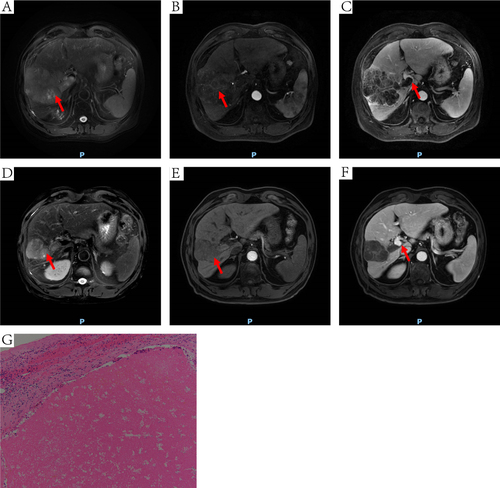
Table 3 Safety Summary