Figures & data
Figure 1 The recruitment process of the cases for this study.
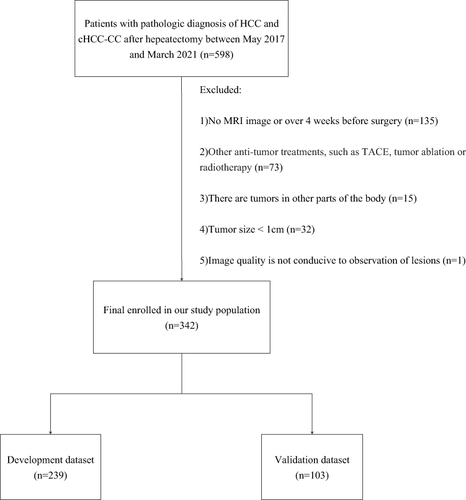
Table 1 Sequences and Parameters of Dynamic-Enhanced MRI
Figure 2 The general flow of radiomics analysis in this study.
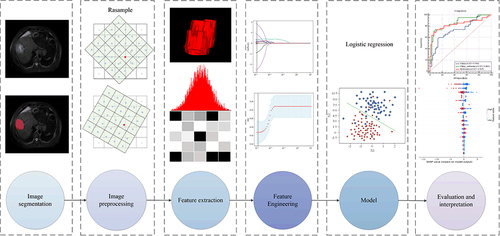
Table 2 Comparison of Patient Characteristics of cHCC-CC and HCC in the Train and Test Set
Table 3 Performance of Each Model Based on Logistic Regression
Figure 3 Comparison of ROC curves in the test set of each model based on logistic regression.
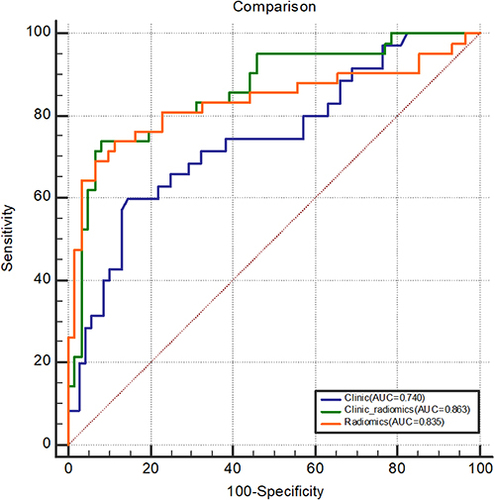
Figure 4 Confusion matrix of the clinic-radiomics model in the test set based on logistic regression.
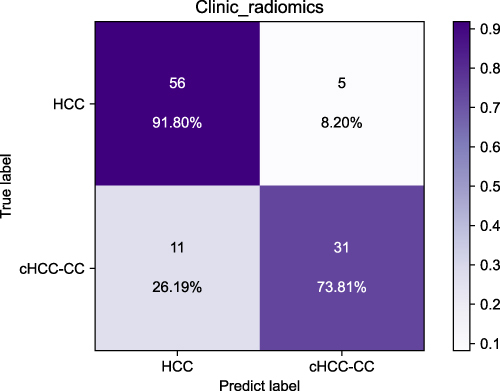
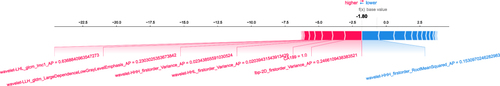
Figure 5 The global SHAP explanatory diagram shows the distribution of features’ influence on the clinic-radiomics model’s output. Red has a positive effect on the prediction and blue has a negative impact.
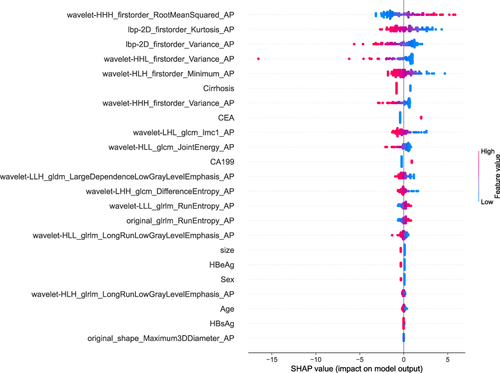
Figure 6 Distribution of importance for each feature in the fusion model based on AP. The value to the right of each red bar is the contribution coefficient of the feature to the model, which is the average value of the absolute value of the SHAP value for each feature.
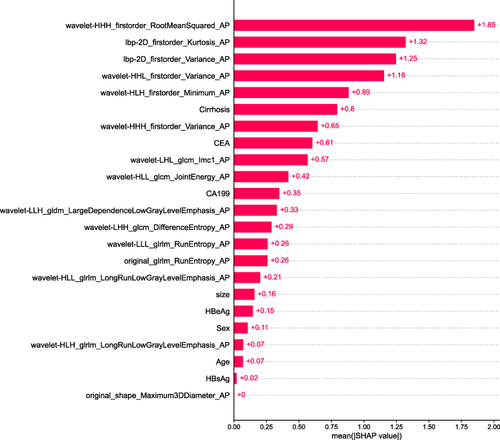
Figure 7 A single-sample SHAP interpretation plot that the model for HCC diagnosed.