Figures & data
Table 1 Association of AHSA1 Expression with Clinicopathological Characteristics of 85 HCC Patients (*χ2-Test)
Figure 1 AHSA1 expression was upregulated and associated with clinicopathological characteristics and overall survival. (A) AHSA1 expression was associated with the staging of HCC: (i) negative in adjacent normal tissues, (ii) weak in TNM stage I, (iii) moderate in TNM stage II, and (iv) strong in TNM stage III. 200× magnification, scale bar 50 μm. (B) AHSA1 expression was significantly higher in 85 pairs of primary HCC tissues than in adjacent nontumor tissues (N = 85, paired-sample t test). (C) Kaplan–Meier survival analysis showed that AHSA1 expression was negatively correlated with the overall survival of all 85 patients with HCC (Log rank test). (D) Kaplan–Meier survival analysis showed that AHSA1 expression was negatively correlated with the overall survival of 43 patients with HCC with TNM stage I + II (Log rank test). (E) Kaplan–Meier survival analysis showed that AHSA1 expression was negatively correlated with the overall survival of 42 patients with HCC with TNM stage III (Log rank test). (F) Nomogram based on AHSA1 expression and sex, age, survival time, survival status, pathological staging, invasive depth, TNM stage, pathological grade, metastasis, and tumor size using Cox regression. R package “rms”, in 85 samples (C-index = 0.76). (G) Prognostic efficacy of AHSA1 in HCC overall survival. ROC function analysis, AUC of 0.80, 0.87, and 0.88 for 1, 3, and 5 years. (H) Bioinformatics analyses of AHSA1 transcripts in normal tissues and primary tumor tissues of LIHC in the UALCAN database (Student t test, ***P < 0.001). (I) AHSA1 transcripts were closely correlated with the TNM stage of patients with HCC (Student t test, ***P < 0.001, **P < 0.01). (J) AHSA1 transcripts were closely correlated with the overall survival of patients with HCC (Log rank test).
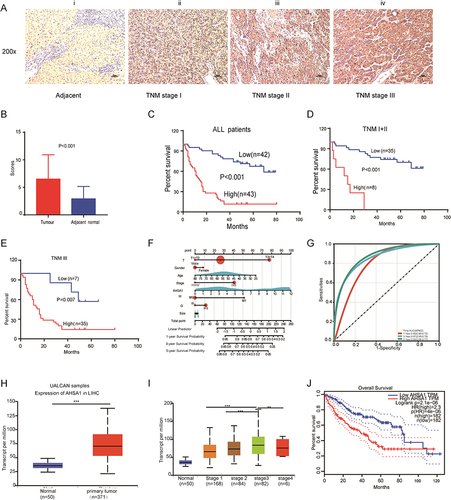
Table 2 Univariate Analysis of Potential Prognostic Factors in 85 HCC Cancer Patients
Figure 2 AHSA1 upregulation promoted HCC proliferation, colony formation, and migration in vitro and in vivo. (A) Western blotting confirmed the AHSA1 upregulation in both SMCC7721 and SK-HEP1 cell lines. (B) CCK-8 assays showed that AHSA1 upregulation induced the growth of SMCC7721 and SK-HEP1 cells (Student t test, **P < 0.01,***P< 0.001). (C) Soft agar assay showed that AHSA1 significantly increased the colony formation of SMCC7721 and SK-HEP1 cells (Student t test, ***P < 0.001). (D) Boyden chamber migration assays showed that AHSA1 significantly increased the migration of SMCC7721 and SK-HEP1 cells (Student t test, **P < 0.01, ***P < 0.001). (E and F) AHSA1 upregulation promoted the tumor growth of SMCC7721 cells in BALB/c nude mice. The data (mean ± SD, n = 6) (Student t test, *P < 0.05, ***P < 0.001). (G) IHC and quantification of scoring for AHSA1, Ki67, and activated caspase 3 on the xenograft sections of SMCC7721 cells (Student t test, **P < 0.01). (H) AHSA1 upregulation promoted the tumor metastasis of SK-HEP1 cells injected through the tail vein in BALB/c nude mice. (I) Kaplan–Meier survival analysis showed that AHSA1 expression was negatively correlated with overall survival in vivo (Log rank test,).
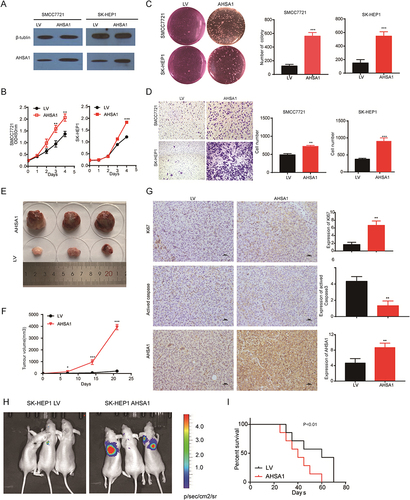
Figure 3 AHSA1-related signaling pathways analysis based on RNA-seq. (A) DEGs between the low- and high- AHSA1 expression subgroups. (B) GSEA analysis was used to evaluate the abundance of main signaling pathways. (C) GO functional enrichment analysis of the molecules interacting with AHSA1.
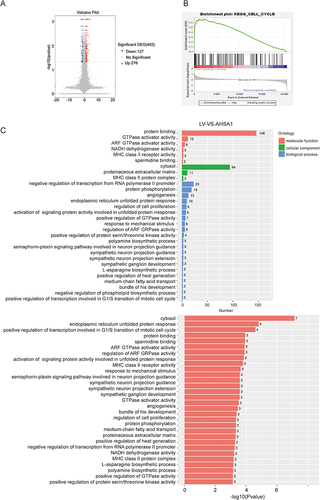
Figure 4 AHSA1 participates in the cell cycle by regulating TGF-β/Akt-cyclinD1/CDK6 signaling pathway to promote the growth of HCC (A) Cell cycle analysis showed that AHSA1 upregulation in SMMC-7721 and SK-HEP1 cells reduced the cell cycle arrest in the G1/G0 phase, as detected by the flow cytometry assays (Student t test, ***P < 0.001). (B) Western blotting showed that AHSA1 upregulation expression increased the expression of cyclin D1, cyclin D3, and CDK6 in both SMMC-7721 and SK-HEP1 cells. GAPDH was used as the protein loading control. The relative protein ratio was quantified using ImagePro Plus 6.0 software and normalized to GAPDH (Student t test, ***P < 0.001). (C) Western blotting showed that AHSA1 regulated the expression of p-Akt and CyclinD1 in SK-HEP1 cells (Student t test, **P < 0.01, ***P < 0.001). (D and E) Boyden chamber migration assays of SK-HEP1 cells after AHSA1 upregulation and treatment with the Akt inhibitor MK2206 (mean ± SD, n = 3; NS P > 0.05, ***P < 0.001). (F) In vitro growth curves of SK-HEP1 cells after AHSA1 upregulation and treatment with the Akt inhibitor MK2206 (mean ± SD, n = 3; Student t test, **P < 0.01). (G and H) Western blotting showed the upregulation of the protein expression of AHSA1 in SK-HEP1 cells treated with the Akt inhibitor MK2206 (n = 3, NS P > 0.05, ***P < 0.001, **P < 0.01). (I) ELISA validation analysis showed the secretion of TGF-β in both SK-HEP1 and SMCC7721 cells (AHSA1 vs LV) (***P < 0.001). (J and K) Western blotting showed the upregulation of the protein expression of AHSA1 in SK-HEP1 cells treated with anti-TGF-β. (***P < 0.001).
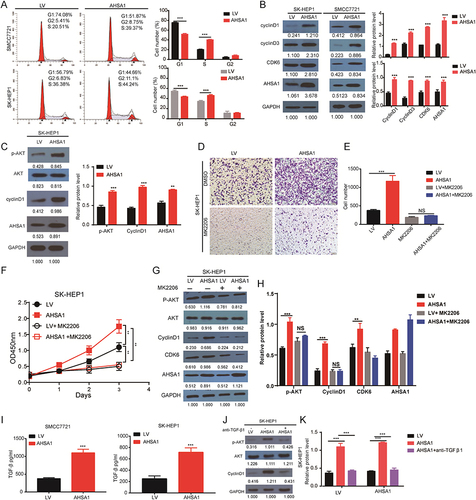
Figure 5 Association of AHSA1 with cyclinD1, cyclinD3, and CDK6 in vivo and in HCC specimens. (A) GEPIA database analysis suggested the transcriptional expression of Akt, cyclin D1, cyclinD3, and CDK6 in TCGA HCC tissues (Pearson correlation analysis, all P < 0.05). (B) IHC staining demonstrated the expression of AHSA1, cyclinD1, cyclinD3, and CDK6 in SMCC-7721 xenograft tumors compared with control tumors (Student t test, ***P < 0.001).
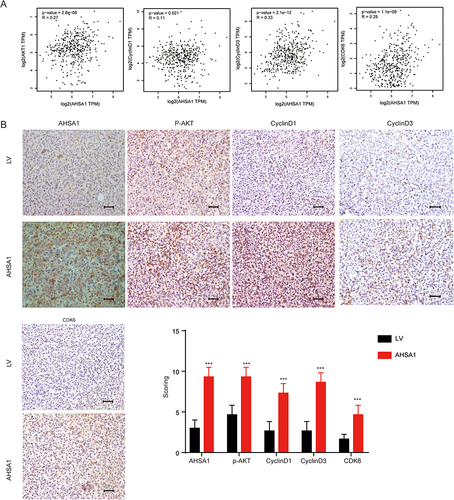
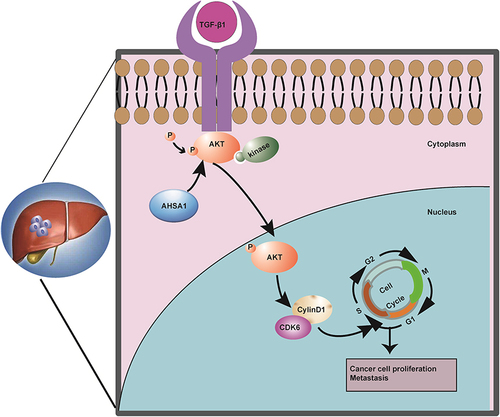
Figure 6 Summary of the key results in the working model.