Figures & data
Figure 1 Low expression of MEG3 predicts poor prognosis in HCC patients. (A) The expression pattern of lncRNA MEG3 in 369 LIHC tissues and 160 normal tissues shown at GEPIA database (http://gepia.cancer-pku.cn/). (B) The overall survival time of HCC patients with high or low expression of MEG3 predicted at Kaplan Meier Plotter database (https://kmplot.com/analysis/). *p < 0.05.
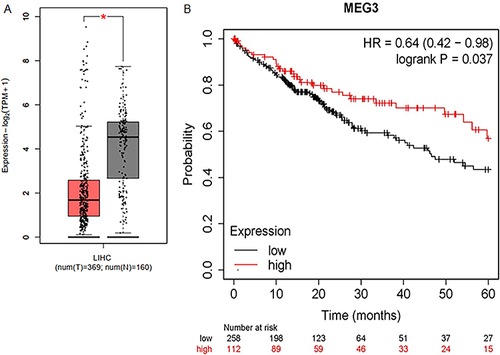
Figure 2 MEG3 participates in M1/M2 macrophage polarization. (A and B) Analysis of F4/80+CD68+ cell percentage in control and LPS/IFNγ-treated BMDMs by using flow cytometry. (C) Detection of MEG3 RNA level in BMDMs after LPS/IFNγ treatment by RT-qPCR. (D and E) Analysis of F4/80+CD206+ cell percentage in control and IL4/IL13-treated BMDMs through flow cytometry. (F) Evaluation of MEG3 RNA level in BMDMs after IL4/IL13 treatment by RT-qPCR. (G and H) Assessment of MEG3 expression in BMDMs after 0, 48 or 72 h treatment of LPS/IFNγ by FISH assay and RT-qPCR analysis. (I and J) Determination of MEG3 expression in BMDMs after 0, 48 or 72 h treatment of IL4/IL13 by FISH assay and RT-qPCR analysis. **p < 0.01.
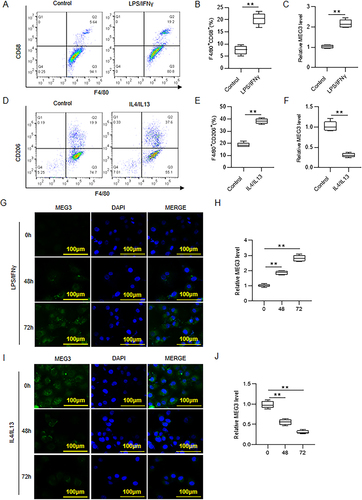
Figure 3 MEG3 suppressed M2 macrophage polarization. (A) Adenovirus vector overexpressing MEG3 (Adv-MEG3) and control vector (Adv-NC) were transfected into IL4/IL13-induced M2-type BMDMs, and the overexpression efficiency was confirmed by RT-qPCR. (B and C) BMDMs were treated with IL4/IL13 to induced M2 phenotype and simultaneously transfected with Adv-NC or Adv-MEG3. CD206+ cell percentage was determined through flow cytometric analysis. (D–F) Assessment of mRNA levels of M2 macrophage marker genes in M2-type BMDMs after Adv-MEG3 or Adv-NC transfection by RT-qPCR. **p < 0.01.
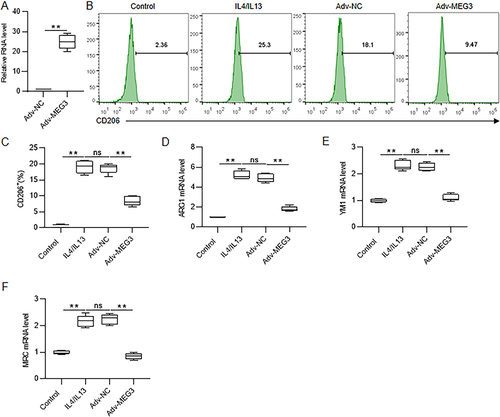
Figure 4 MEG3 inhibits M2 macrophage polarization-induced HCC cell metastasis and angiogenesis. Huh7 cells were cultured for 24 h with condition medium (CM) from Adv-MEG3-transfected M2-type BMDMs. (A–D) Examination of Huh7 cell migration and invasion by Transwell assays. (E and F) Measurement of capillary-like tube formation of HUVECs in the presence of CM through tube formation experiment. **p < 0.01.
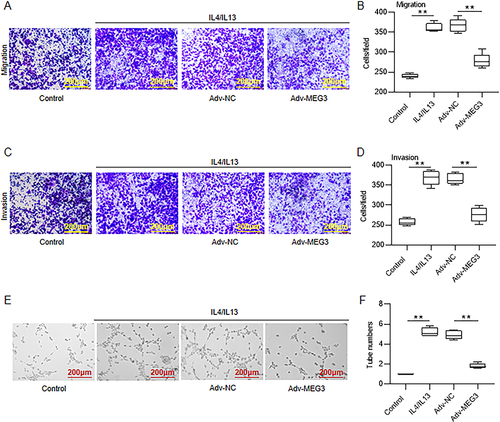
Figure 5 MEG3 represses in vivo tumor growth by inhibiting M2 macrophage polarization. Nude mice were injected subcutaneously with Huh7 cells only, mixture of Huh7 cells and Adv-NC-transfected M2-type BMDMs, or mixture of Huh7 cells and Adv-MEG3-transfected M2-type BMDMs. (A) The primary tumors were excised and photographed after mice were sacrificed. (B) Tumor weight. (C) Body weight of mice. (D) Examination of the histopathological characteristics of the tumors by hematoxylin and eosin (H&E) staining. (E–H) Determination of Ki67 and CD206 expression in tumor tissues by immunohistochemistry staining. (I–K) Detection of mRNA expression of M2 polarization markers by RT-qPCR analysis. N = 8 per group. **p < 0.01.
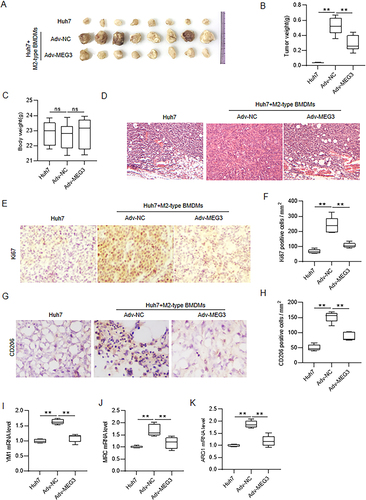
Table 1 Five Candidate Downstream miRNAs of MEG3 Predicted at ENCORI Database (Screening Condition: clipExpNum>5)
Figure 6 LncRNA MEG3 binds with miR-145-5p. (A) Evaluation of the mRNA levels of five candidate downstream miRNAs of MEG3 in Huh7 cells transfected with Adv-NC or Adv-MEG3 by RT-qPCR. (B and C) Detection of miR-145-5p expression level in LPS/IFNγ-induced M1-type and IL4/IL13-induced M2-type BMDMs by RT-qPCR. (D) Examination of miR-145-5p expression in Huh7 cells transfected with miR-NC or miR-145-5p by RT-qPCR. (E) The binding site of miR-145-5p on MEG3 shown at ENCORI database (https://starbase.sysu.edu.cn/). (F) Huh7 cells were cotransfected with pmirGLO vectors carrying wild-type or mutant binding site of MEG3 and miR-NC or miR-145-5p mimics. The luciferase activities of vectors were measured after 48 h. **p < 0.01.
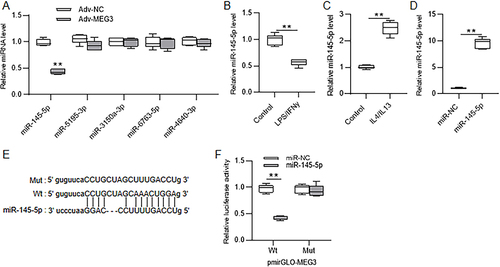
Figure 7 MiR-145-5p direct targets DAB2. (A) Prediction of candidate target genes of miR-145-5p at miRDB database (https://mirdb.org/) under the screening condition of target score=100. (B) Analysis of changes in candidate gene expression after miR-145-5p overexpression in Huh7 cells by RT-qPCR. (C and D) Assessment of DAB2 expression level in LPS/IFNγ-induced M1-type and IL4/IL13-induced M2-type BMDMs by RT-qPCR. (E) The binding sites of miR-145-5p on DAB2 3’UTR predicted at TargetScan database (https://www.targetscan.org/). (F) Huh7 cells were cotransfected with pmirGLO vector containing wild-type or mutant fragment of DAB2 3’UTR and miR-NC or miR-145-5p mimics. The luciferase activities were detected 48 h later. **p < 0.01.
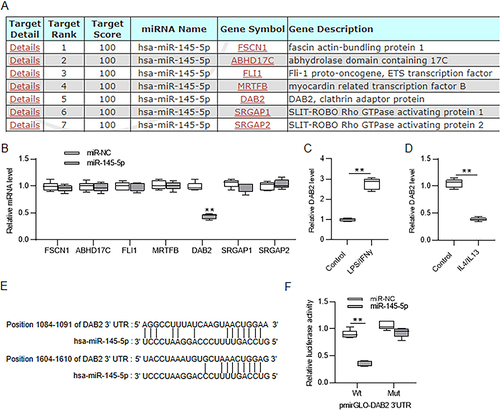
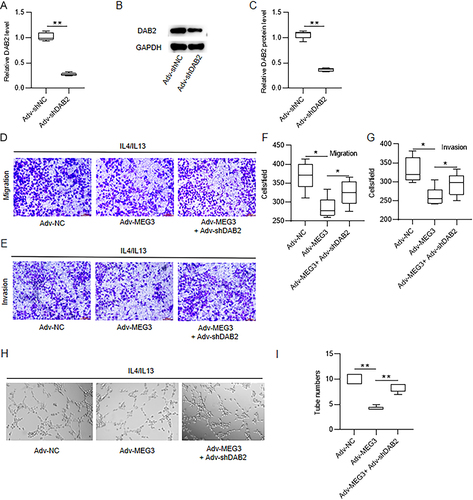
Figure 8 DAB2 knockdown reverses the influence of MEG3 overexpression on HCC cell metastasis and angiogenesis. (A–C) Huh7 cells were transfected with Adv-shNC or Adv-shDAB2, and the interfering efficiency of DAB2 was determined by RT-qPCR and Western blotting. (D–G) Huh7 cells were cultured for 24 h with condition medium (CM) from Adv-MEG3+Adv-shDAB2-cotransfected M2-type BMDMs. Huh7 cell migratory and invasive abilities were examined via Transwell assays. (H and I) Tube-like structures formation of HUVECs in vitro was measured through endothelial cell tube formation assay. *p < 0.05, **p < 0.01.