
Figures & data
Figure 1 Flow diagram of patient enrollment.
Abbreviations: DEB-TACE, drug-eluting bead transcatheter arterial chemoembolization; TACE, transcatheter arterial chemoembolization; cTACE, conventional transcatheter arterial chemoembolization; HAIC, hepatic artery infusion chemotherapy; LEN, lenvatinib; ICIs, immune checkpoint inhibitors; ORR, objective response rate; PFS, progression-free survival; mRECIST, modified Response Evaluation Criteria in Solid Tumors.
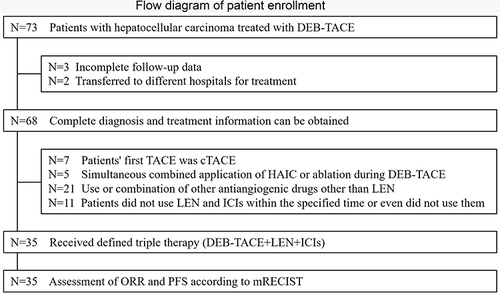
Table 1 Baseline Characteristics in 35 Patients
Figure 2 Kaplan-Meier analyses of progression-free survival according to treatment group.
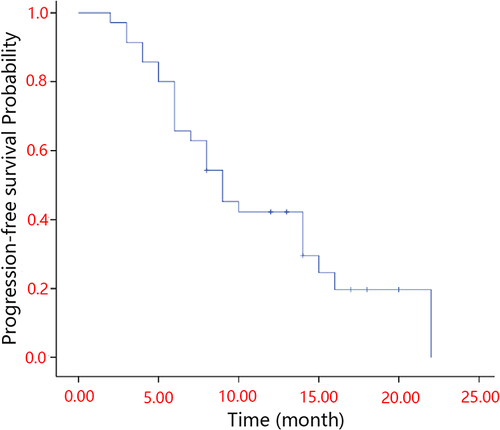
Table 2 Radiological Responses According to the mRECIST Criteria and Clinical Efficacy
Table 3 Tumor Responses According to the mRECIST Criteria for Different BCLC Stage
Figure 3 (a) Waterfall chart of target tumor response produced by investigator using the mRECIST criteria. (b) Tumor responses according to the mRECIST criteria for different BCLC stage.
Abbreviations: mRECIST, modified Response Evaluation Criteria in Solid Tumors; BCLC, Barcelona Clinic Liver Cancer; CR, complete response; PR, partial response; SD, stable disease; PD, progressive disease.
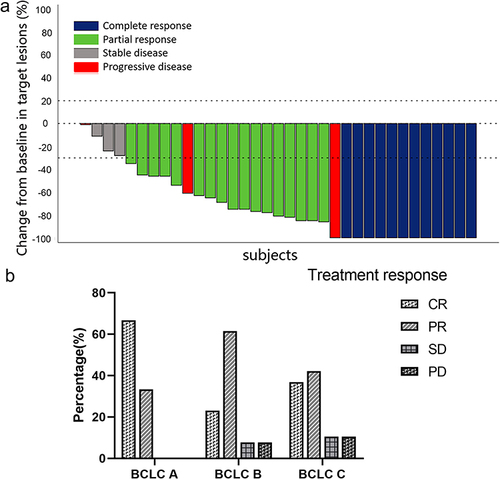
Table 4 Treatment-Related Adverse Events [n (%)]