Figures & data
Table 1 Participant Characteristics in the Study
Figure 1 Cytokine quantification and Spearman correlation matrix of IL-27, MIP-1β, Perforin, sCD137, sFas, and TNF-α in patients and healthy controls. (A) Expression levels of IL-27, MIP-1β, Perforin, sCD137, sFas, and TNF-α in HCC (red color, n= 38) and healthy (grey color, n= 15) cohorts. Each dot represents an individual. Data were presented as mean ± SEM. *p<0.05, **p<0.01, and ****p<0.0001 (Mann–Whitney U-test). (B) Spearman correlation matrix of six cytokines in each control or HCC cohort and both cohorts. Spearman correlation coefficients (r) range from −1 to 1. The sign of the coefficient represents whether the relationship is positive (+) or negative (-) monotonic. Values closer to 1 (blue) and −1 (red) indicate a stronger correlation than values closer to 0 (white).
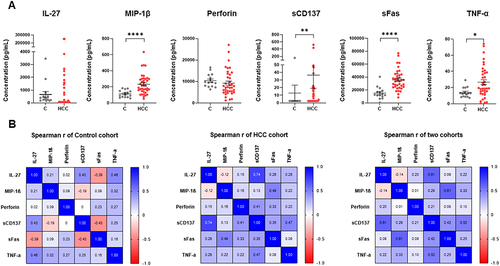
Figure 2 Selection of the best predictable model. (A) The bar chart of –log10 (p-value) and the coefficient of six models based on one cytokine. (B) Multiple ROC curves of three models: sFas (blue line), sFas – sCD137 (black line), and sFas – sCD137 – IL-27 (red line). (C) Line graph of ACC (black line) and AUC (red line) of the six statistically significant models.
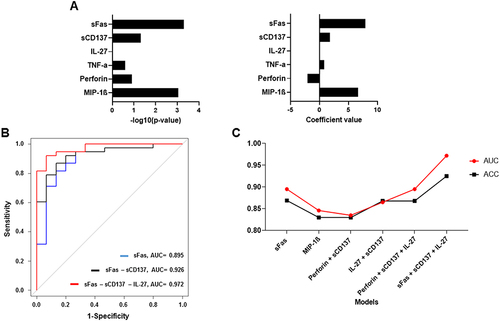
Figure 3 Features of the best-performing model: sFas – sCD137 – IL-27. (A) Logistic regression of the best-performing model. (B) ROC curve analysis with bias-corrected AUC of model sFas – sCD137 – IL-27. (C) Calibration plot of the best model. The 45-degree line (“ideal” line) represents a perfect fit between the predicted probability and the observed HCC rate, while the “apparent” line indicates the in-sample calibration. The ideal mean absolute error should be closer to 0 (0 would be perfectly indicating no error).
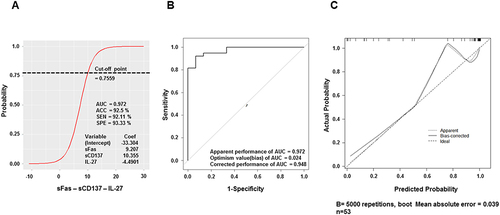
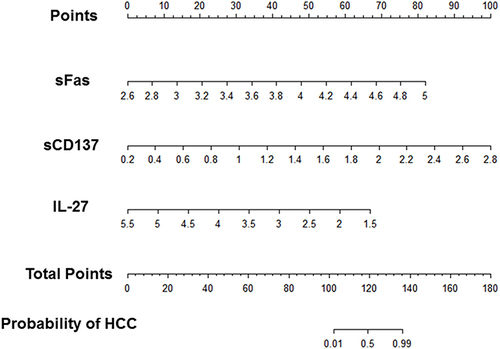
Figure 4 Diagnostic nomograms of the best-performing models predicting the probability of HCC. Log10 values of sFas, sCD137, and IL-27 cytokines concentration are equated to points by drawing a straight line to the Points axis. Total points were summed and located on the total point line. Then, a vertical line was projected from the total point line to the predicted probability scale to obtain the patient’s probability of HCC.