Figures & data
Table 1 Demographics and Baseline Characteristics of Patients with PD-L1
Table 2 Demographics and Baseline Characteristics of Patients with IDO
Figure 1 The expression of PD-L1 and IDO detected by immunohistochemical staining. Representative images of immunohistochemical staining of PD-L1 and IDO in HCC cases: (A) Positive strong membranous PD-L1 staining in tumor cells with high PD-L1 expression indicated by black arrow. (B) Negative PD-L1 expression. (C) Strong diffuse high cytoplasmic IDO expression. (D) Weak patchy low cytoplasmic IDO expression. (E and F) High PD-L1 and IDO expression in the same tissue specimen respectively. (G and H) IDO+ and negative PD-L1- in the same tissue specimen respectively. All images were captured at 40X magnification.
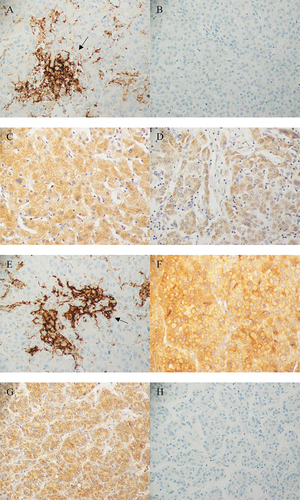
Table 3 Clinicopathological and Radiological Characteristic of Non-Survivor HCC Patients Along with PD-L1/IDO Expression
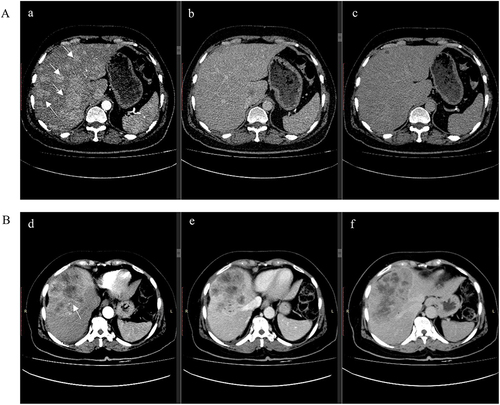
Figure 2 Computed tomography (CT) of Multifocal HCC vs Solitary HCC. (A) CT post-contrast axial a: arterial-phase b: portal venous phase and c: delayed phase images. Innumerable arterially enhancing hepatic lesions of variable sizes are seen demonstrating washout on the portal venous phase, consistent with multifocal HCC. (B); CT post-contrast d: arterial-phase e: portal venous phase and f: delayed phase images, showing relatively circumscribed centrally necrotic mass measuring 8.4×13.9 cm demonstrating peripheral arterial enhancement with venous washout and an enhancing pseudo capsule; this is centered in hepatic segments 4, 5 and 8, and approaches the capsule. Imaging features are compatible with solitary HCC.