Figures & data
Figure 1 The flow chart of participants’ inclusion and exclusion.
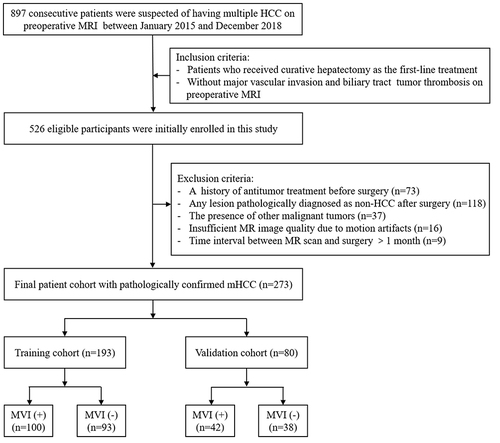
Table 1 Baseline Characteristics of mHCC Patients in the Training and Validation Cohort
Table 2 MR Features of mHCC Patients in the Training and Validation Cohort
Table 3 Univariable and Multivariable Analysis of MVI in the Training Cohort
Table 4 Risk Score for Factors Associated with MVI of Multinodular HCC
Figure 2 The calibration curve compared predicted and observed probability of microvascular invasion in the (A) training cohort and (B) validation cohort.
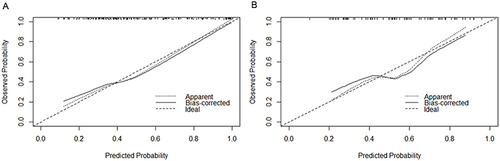
Figure 3 47-year-old man without pathological microvascular invasion. The serum α-fetoprotein was < 400 ng/mL. The Axial contrast-enhanced MR demonstrated two HCC lesions in the right liver section with the total diameter of 3.7 cm. Both lesions contained fat (A and B, white arrows) and demonstrated hyperintense on T2-weighted image (C), diffusion-weighted image (D) and hypointense on T1-weighted image (E). After the injection of contrast agent, both lesions showed typical enhancement pattern with enhancement on the arterial phase (F) and washout on the portal phase (G) and delayed phase (H). Both lesions showed compete radiological capsule. Risk score value of 0 score categorized the patient into low-risk group. After the surgery, no recurrence was observed and the recurrence-free survival was 36 months.
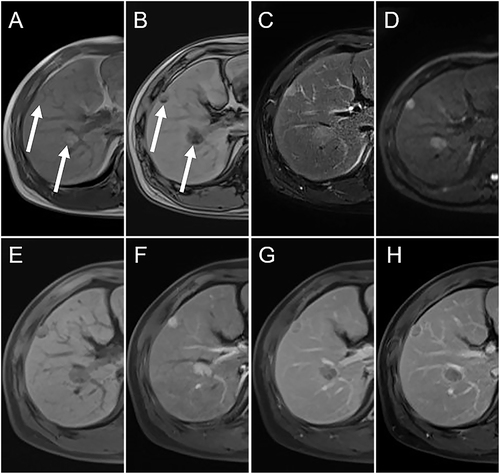
Figure 4 56-year-old man with pathological microvascular invasion. The serum α-fetoprotein was > 400 ng/mL. Axial contrast-enhanced MR demonstrated two HCC lesions in the right liver section with the total diameter of 9.5 cm. Both lesions showed hyperintense on T2-weighted image (A1 and A2) and diffusion-weighted image (B1 and B2) and hypointense on T1-weighted image (C1 and C2). Both lesions showed typical enhancement pattern with enhancement on the arterial phase (D1 and D2) and washout on the portal phase (E1 and E2) and delayed phase (F1 and F2). The smaller lesion showed hemorrhage in mass (C2) and mosaic architecture (D2, arrow). The tumor emboli were found in the specimen sampled at the junction of the smaller tumor (A2–F2) and adjacent liver tissues. Risk score value of 5 categorized the patient into high-risk group. After surgery, recurrence was observed and the recurrence-free survival was 9 months.
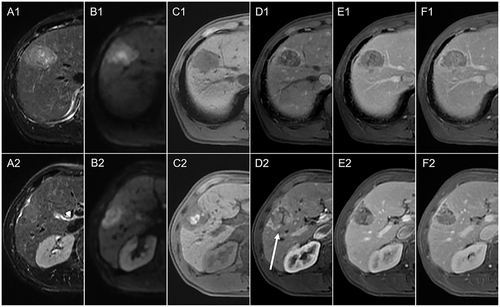
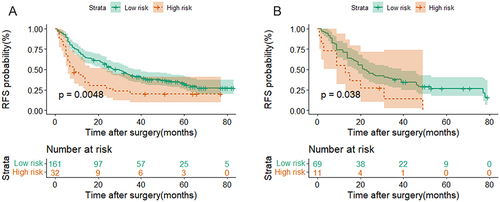
Figure 5 MVI Risk Score-based Prognostic Stratification. Graphs showed that multinodular HCC patients in the low-risk groups had significantly shorter RFS than those in the high-risk group in the (A) training cohort and (B) validation cohort (Log rank test, both P < 0.05).