
Figures & data
Figure 1 scRNA-seq profiling of the tumor ecosystem in primary HCC. (A) T-distributed stochastic neighbor embedding (t-SNE) plot showing the annotation and color codes for cell types in the HCC ecosystem. (B) The expression of marker genes in the indicated cell types. (C) The relationship between cells and the prognosis of HCC patients. Red represents poor survival, blue represents favorable survival, and gray is meaningless. (D) The proportions of prognosis-related cells in myeloid cell, malignant cell and CD8+ T-cell types. (E) The regulatory network between various groups of cells in the HCC tumor microenvironment based on the receptor ligand exchange mode. The connecting line between cell groups represents the regulatory relationship between the two cells, and the thickness of the line represents the number of receptor ligand pairs (left) and interaction intensity (right). (F) The number and intensity of regulation between receptor‒ligand pairs among cell groups. (G) The regulatory relationship of a specific signaling pathway between cell groups.
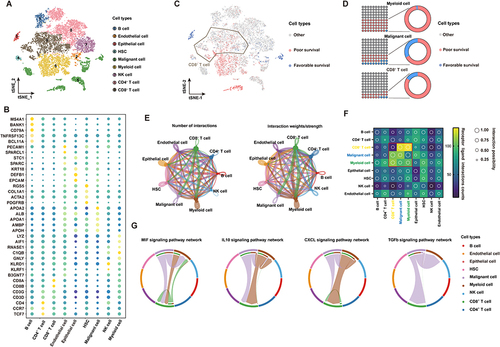
Figure 2 The subtypes of T cells and cell transition states in primary HCC. (A) t-SNE projections of subclustered T cells, labeled in different colors. Cell type annotations are provided in the figure. (B) The expression of selected gene sets, including markers of naïve and resident cells, inhibitory molecules, cytokines, costimulatory markers, transcription factors, and cell type markers, in T-cell subtypes. (C) The t-SNE plot showing cell origins by color, showing the relationship between cells and the prognosis of HCC patients. (D) Pseudotime-ordered analysis of CD8+ T cells from primary HCC samples. (E) 2D pseudotime plot showing the dynamics of cytotoxic (upper panel) or exhausted signals (lower panel) in CD8+ T cells from primary HCC samples. (F) The dynamic changes in gene expression along with pseudotime (lower panel). The distribution of CD8 subtypes during the transition (divided into 5 phases), along with pseudotime. Subtypes are labeled by colors (upper panel). (G) Immunofluorescence images showing the colocalization of CD274 and CD8 in HCC tissue. Scale bar for all images = 50 µm.
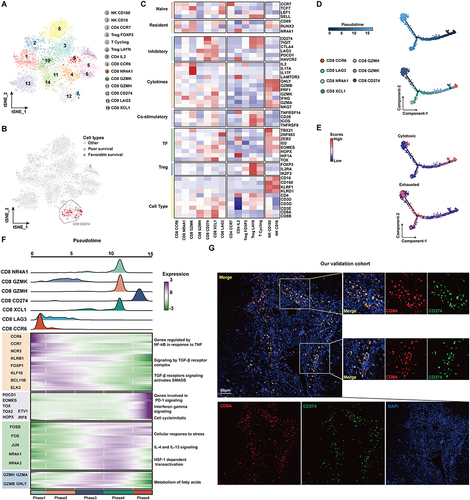
Figure 3 The prognostic significance of CD274 is dependent on CD8A expression in HCC. (A) Dotplots showing HR (up) and Pscore (bottom) for different CD8A expression cutoffs in TCGA HCC patients. The dotted line represents HR = 1 (up) and Pscore= 1.3 (equivalent to P<0.05, bottom). (B) Similar to (A), but for CD274. The Orange arrow represents the optimal cutoff. (C) Kaplan–Meier plot showing the OS for CD274 in TCGA HCC patients according to the optimal cutoff. (D) Pearson correlation between CD8A and CD274 expression in TCGA HCC patients. Vertical blue lines represent the median value of CD8A. The horizontal dark blue line represents the optimal cutoff of CD274 in CD8ALow patients. (E) Similar to (A), but for CD274 in CD8ALow patients. (F) Kaplan–Meier plot showing the OS for CD274 in CD8ALow patients according to the optimal cutoff. (G–I) Similar to (D–F), but for CD274 in CD8AHigh cases. (J and K) Kaplan–Meier plots showing the OS for CD274 in CD8AHigh patients (J) or CD8ALow patients (K) in the LIRI-JP HCC cohort according to the optimal cutoff.
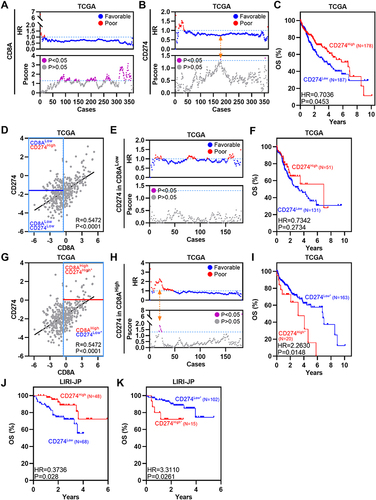
Figure 4 CD8AHighCD274High* patients represent a novel high-risk subtype in HCC. (A) Pearson correlation between CD8A and CD274 expression in TCGA HCC patients (left). Vertical blue lines represent the median value of CD8A. The horizontal dark blue line represents the optimal cutoff of CD274 in CD8AHigh patients. Kaplan–Meier plots showing the OS for each CD8A/CD274 subtype in TCGA HCC patients. (B–D) Similar to (A), but in GSE76427 (B), LIRI-JP (C) and CPTAC protein (D) HCC cohorts. (E) GSEA plots showing that the CD8AHighCD274High* subgroup was significantly correlated with a higher risk of recurrence in TCGA HCC patients. (F and G) Univariable and multivariate COX regression models showing the effect of the CD8A/CD274 stratification system, TNM stage, grade and vascular invasion indexes on OS in TCGA HCC patients. (H) Multivariate Cox regression models showing the effect of CD8A/CD274, T stage and N stage on OS (G) in TCGA HCC patients. (I) Pie charts showing the chi-squared test of clinicopathologic factors for CD8A/CD274 stratification system TNM stage, grade and vascular invasion indexes from the TCGA HCC cohort.
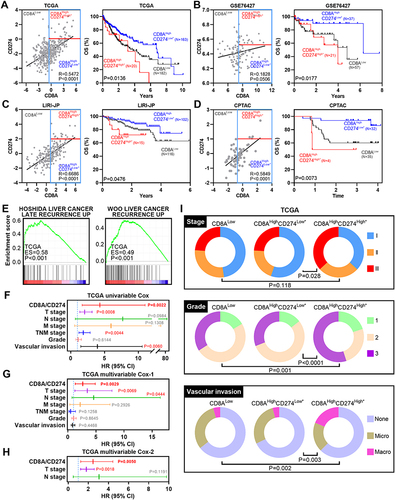
Figure 5 Wet-laboratory experimental validation in our independent HCC cohort. (A) IHC staining assay of each CD8A/CD274 subtype in the validation HCC cohort. Scale bar for all images = 100 µm. (B) Kaplan–Meier plots showing the OS for each CD8A/CD274 subtype in the validation HCC cohort. (C and D) Stacked bar plot showing the chi-squared test of survival (C) and recurrence (D) status for each CD8A/CD274 subgroup in the validation HCC cohort. (E and F) Univariable and multivariate COX regression models showing the effect of the CD8A/CD274 stratification system, TNM stage and grade on OS in our validation cohort.
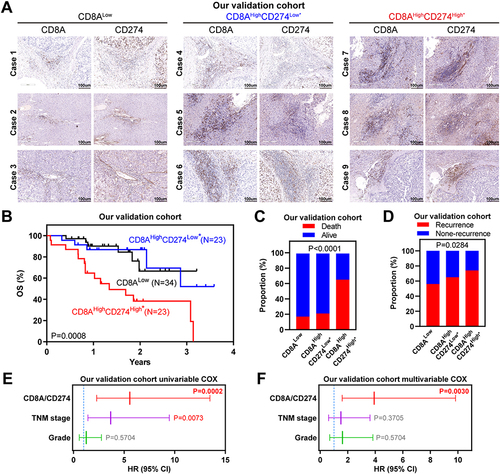
Figure 6 Molecular characteristics of the CD8AHighCD274High* subgroup. (A) Mutation profiles of the 20 most mutated genes in the CD8AHighCD274High* subgroup or non-CD8AHighCD274High* samples among TCGA HCC tumor samples. (B) Boxplot showing the mutation rate of total genes grouped by CD8AHighCD274High* and non-CD8AHighCD274High* patients from the TCGA HCC cohort. (C) Barplot showing the top 20 significantly enriched GO BP signatures in the CD8AHighCD274High* subgroup from the TCGA HCC cohort based on ES. (D) Barplot showing the top significantly enriched HALLMARK signatures in the CD8AHighCD274High* subgroup from the TCGA HCC cohort. (E) Barplot showing the top 20 significantly enriched KEGG signatures in the CD8AHighCD274High* subgroup from the TCGA HCC cohort based on ES. (F) GSEA plots showing that the CD8AHighCD274High* subgroup was significantly correlated with higher T-cell receptor signaling pathway, E2F target and cell cycle signatures in TCGA HCC patients.
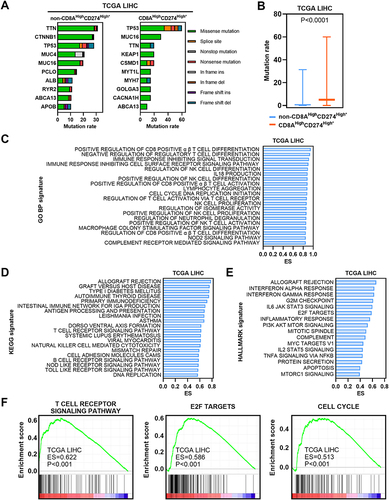
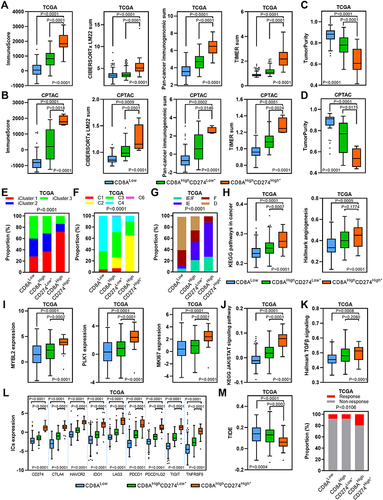
Figure 7 TME characteristics of the CD8AHighCD274High* subgroup. (A and B) Boxplots showing the total immune infiltrates based on ESTIMATE, CIBERSORTx, Pan-cancer immunogenomic analysis signature and TIMER for each CD8A/CD274 subtype in TCGA (a) and CPTAC protein (b) HCC cohorts. (C and D) Boxplots showing the total tumor purity based on the ESTIMATE algorithm for each CD8A/CD274 subtype in the TCGA (c) and CPTAC protein (d) HCC cohorts. (E–G) Stacked bar-plot showing the Chi-squared test of TCGA HCC subtype (e), TCGA immune subtype (f) and TCGA TME subtype (g) for each CD8A/CD274 subgroup in TCGA HCC cases. (H) Boxplots showing the levels of KEGG pathways in cancer and hallmark angiogenesis signatures for each CD8A/CD274 subtype in the TCGA HCC cohort. (I) Boxplots showing the expression of MYBL2, PLK1, and MKI67 for each CD8A/CD274 subtype in the TCGA HCC cohort. (J and K) Similar to (H), but for the KEGG JAK/STAT signaling pathway and hallmark TGF-β signaling signatures. (L) Boxplot showing the expression of ICs for each CD8A/CD274 subtype in the TCGA HCC cohort. (M) Boxplot showing the TIDE score for each CD8A/CD274 subtype in the TCGA HCC cohort (left). Stacked bar-plot showing the Chi-squared test of IC inhibitor-response status for each CD8A/CD274 subgroup in the TCGA HCC cohort (right).
Data Sharing Statement
Available public datasets are described in Materials and Methods. The data that support this study are available from the corresponding author upon reasonable request.