Figures & data
Figure 1 Differentially expressed lncRNAs in HCC. (A) Chromosomal distribution of the DELs among CON, LC and HCC tissues. (B) Mfuzz clustering of DELs demonstrated the dynamic changes in the expression patterns of DELs during hepatocellular carcinogenesis. (C) Clustering Heatmap of DELs among CON, LC and HCC tissues. The columns represented the clinical liver samples, and the rows indicated as DELs. The samples were correspondingly gathered into three clusters according to the three comparison groups. (D) Volcano plots for DELs between paired normal and HCC samples in TCGA-HCC. The red points indicated up-regulated lncRNAs, while the blue points represented down-regulated lncRNAs in tumor samples of TCGA-HCC. The grey points represented non-significant differently expressed lncRNAs. (E) Venn diagram of up-regulated DELs between cluster 4 and the TCGA-HCC dataset. Relative LINC00886 expression levels were detected utilizing qRT-PCR in hepatic tissues ((F), n=5 per group), HCC cells (G) and PBMC samples ((H), n=20 per group). ****P < 0.0001.
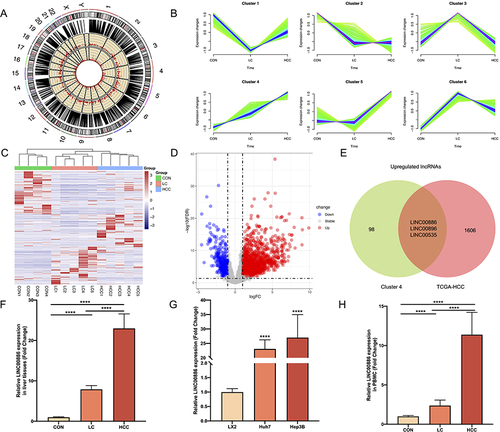
Figure 2 LINC00886 silencing impeded HCC progression. (A-D) Cell proliferation rate was measured via Edu assay (Scale bar, 100 µm) and CCK-8 assay after transfection of Si-NC, Si-LINC00886, pcDNA3.1 or pcDNA3.1-LINC00886 into Hep3B and Huh7 cells. (E) Evaluation of migrating and invading cells using Transwell assay (Scale bar, 50 µm). (F) Cell migration was estimated via Scratch assay at 0 h and 48 h after transfection (Scale bar, 200 µm). *P<0.05, **P<0.01, ***P<0.001, ****P<0.0001, respectively. ##P<0.01, ###P<0.001, ####P<0.0001, respectively.
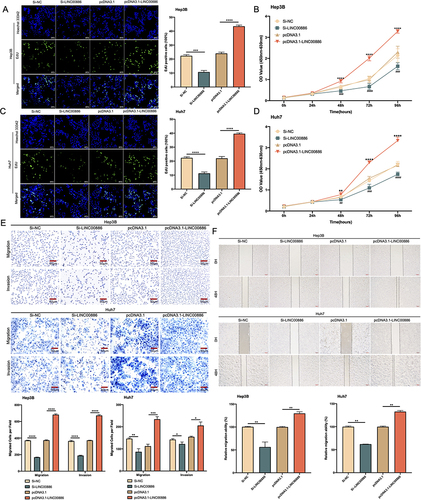
Figure 3 LINC00886 upregulation hindered apoptosis through NF-κB pathway in HCC cells. TUNEL assay (A and B) was performed to assess apoptotic cells (Scale bar, 100 µm) after transfection of Si-NC, Si-LINC00886, pcDNA3.1 or pcDNA3.1-LINC00886 in Hep3B and Huh7 cells. Western blotting (C and D) was utilized to analysis the expression of NF-κB pathway-associated proteins (IκBα, p-IκBα, IKKβ, p-IKKα/β, total p65, total p50, nuclear p65 and p50). *P<0.05, **P<0.01, ***P<0.001, ****P<0.0001, respectively.
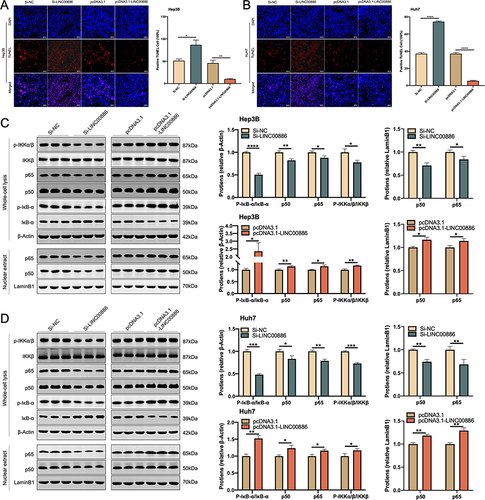
Figure 4 miR-409-3p or miR-214-5p is a target of LINC00886. The subcellular LINC00886 expression of Hep3B (A) and Huh7 cells (B) was examined. (C and D) FISH assay was performed in Hep3B and Huh7 cells to identify subcellular location of LINC00886 (Scale bar, 50 μm). (E and F) qRT-PCR was administrated to estimate the expression of miR-409-3p and miR-214-5p following HCC cell transfection of Si-NC, Si-LINC00886, pcDNA3.1 or pcDNA3.1-LINC00886. (G) Binding sites of LINC00886 on miR-409-3p or miR-214-5p predicted using starbase were demonstrated. (H and I) Direct binding of LINC00886 on miR-409-3p or miR-214-5p was validated vis dual-luciferase reporter assays. Western blotting was utilized to access the protein levels of RAB10 (J) and E2F2 (K) after transfection of HCC cells with miR-NCs, miR-409-3p /miR-214-5p mimics, and miR-409-3p/miR-214-5p inhibitors, respectively. (L and M) Western blotting was administrated to access the protein levels of RAB10 and E2F2 following HCC cell transfection of Si-NC, Si-LINC00886, pcDNA3.1 or pcDNA3.1-LINC00886, respectively. *P<0.05, **P<0.01, ***P<0.001, ****P<0.0001, respectively.
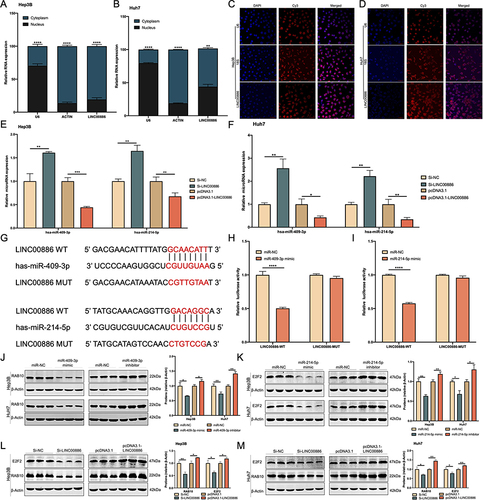
Figure 5 miR-409-3p suppression counteracts the inhibitory impact of LINC00886 silencing on HCC progression. Edu assay (Scale bar, 100 µm) and CCK-8 (A-D) were applied to analyze proliferative cells after introduction of Si-LINC00886+miR-NC, pcDNA3.1-LINC00886+miR-NC, Si-LINC00886+miR-409-3p inhibitor or pcDNA3.1-LINC00886+miR-409-3p mimic into Hep3B and Huh7 cells. (E and F) Migratory and invasive cells were evaluated utilizing Transwell (Scale bar, 50 µm) and Scratch assays (Scale bar, 200 µm). *P<0.05, **P<0.01, ***P<0.001, ****P<0.0001, respectively. #P<0.05, ##P<0.01, ####P<0.0001, respectively.
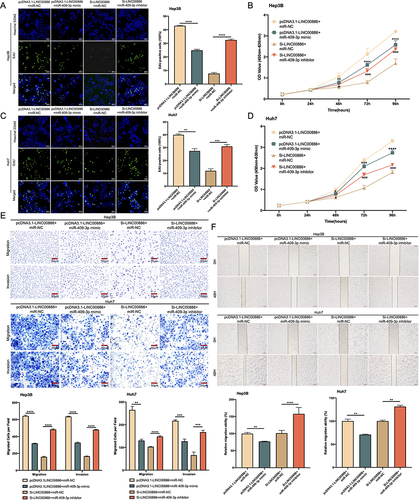
Figure 6 Suppression of miR-409-3p offsets the pro-apoptotic role of LINC00886 silencing in HCC via NF-κB pathway. (A and B) Apoptotic cells were monitored via TUNEL assay (Scale bar, 100 µm) after introduction of Si-LINC00886+miR-NC, pcDNA3.1-LINC00886+miR-NC, Si-LINC00886+miR-409-3p inhibitor or pcDNA3.1-LINC00886+miR-409-3p mimic into Hep3B and Huh7 cells. (C and D) Western blotting was employed to evaluate RAB10 expression and NF-κB pathway-related markers. *P<0.05, **P<0.01, ***P<0.001, ****P<0.0001, respectively.
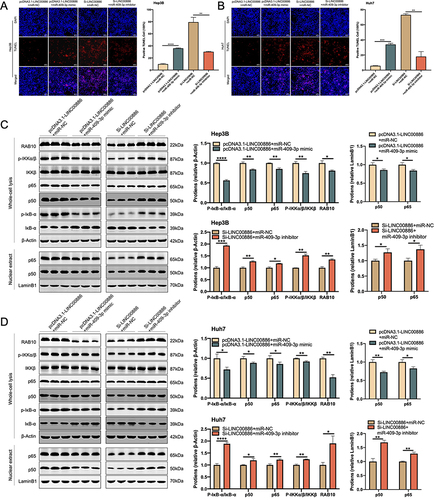
Figure 7 miR-214-5p upregulation attenuates the impact of LINC00886 overexpression on HCC progression. (A-D) Edu (Scale bar, 100 µm) and CCK-8 assays were applied to access proliferative potential of HCC cells after transfection of Si-LINC00886+miR-NC, pcDNA3.1-LINC00886+miR-NC, Si-LINC00886+miR-214-5p inhibitor or pcDNA3.1-LINC00886+miR-214-5p mimic into Hep3B and Huh7 cells. (E and F) Migrated and invaded cells was evaluated via Transwell (Scale bar, 50 µm) and Scratch assays (Scale bar, 200 µm). **P<0.01, ***P<0.001, ****P<0.0001, respectively. ###P<0.001, ####P<0.0001, respectively.
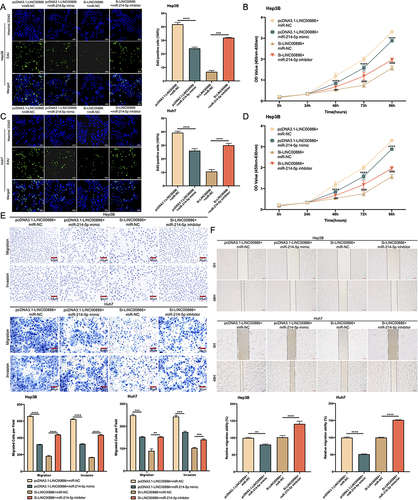
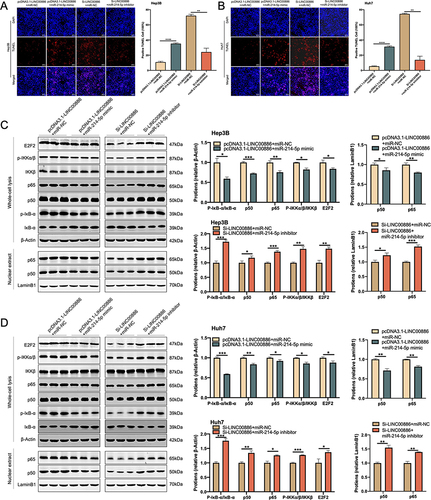
Figure 8 miR-214-5p Overexpression abrogates the apoptotic suppression function of LINC00886 upregulation in HCC by means of NF-κB pathway. (A and B) Apoptotic cells were monitored utilizing TUNEL assay (Scale bar, 100 µm) after transfection of Si-LINC00886+miR-NC, pcDNA3.1-LINC00886+miR-NC, Si-LINC00886+miR-214-5p inhibitor or pcDNA3.1-LINC00886+miR-214-5p mimic into Hep3B and Huh7 cells. (C and D) Western blotting was utilized to quantify E2F2, IκBα, p-IκBα, IKKβ, p-IKKα/β, total p65, total p50, nuclear p65 and p50 protein levels. *P<0.05, **P<0.01, ***P<0.001, ****P<0.0001, respectively.