Figures & data
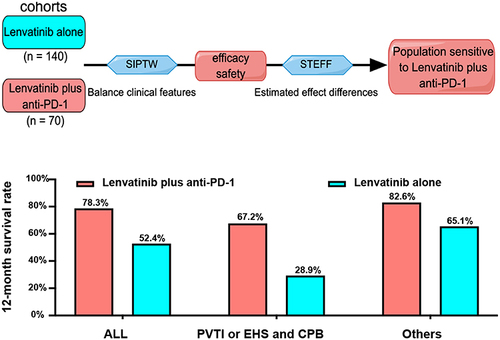
Table 1 Clinical Features of the Lenvatinib Alone Group (Monotherapy) and the Lenvatinib Plus Anti-PD-1 Group (Combination Therapy) Before and After SIPTW Adjustment
Figure 1 Survival outcomes in the combination and monotherapy groups. (A) Overall survival. (B) Overall survival after SIPTW adjustment. (C) Progression-free survival. (D) Progression-free survival after SIPTW adjustment.
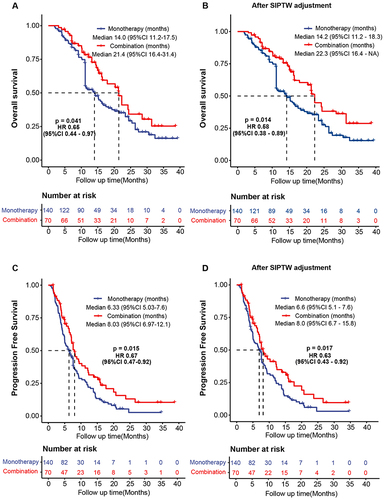
Figure 2 12-month survival rate according to cycles of anti-PD-1. (A) The 12-month survival rate (y-axis) according to the median cycles of anti-PD-1 in subpopulations (x-axis) through subpopulation treatment effect pattern plot analysis (STEFF). (B) Overall survival of the monotherapy and combination groups.
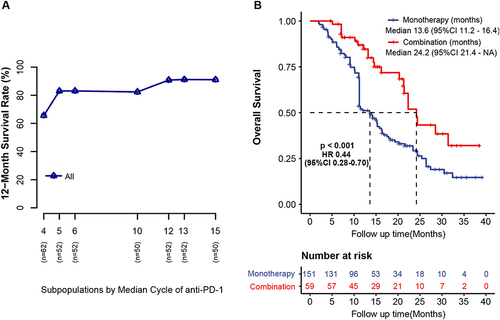
Table 2 Tumor Responses in the Lenvatinib Alone Group (Monotherapy%) and the Lenvatinib Plus Anti-PD-1 Group (Combination Therapy%) by Response Evaluation Criteria in Solid Tumors v1.1 Before and After SIPTW Adjustment
Table 3 The Independent Factors of Over Survival by SIPTW-Weighted Cox Regression Analysis
Figure 3 Overall survival according to the composite risk scores. (A) 12-month survival rate (y-axis) by median composite risk scores in subpopulations (x-axis). (B) Overall survival by the quartile of the composite risk scores. (C) 12-month survival rate (y-axis) according to the median composite risk scores in subpopulations (x-axis) through subpopulation treatment effect pattern plot analysis (STEFF). (D) The difference in 12-month survival rate (y-axis) between the combination and monotherapy groups according to the median composite risk scores in subpopulations (x-axis). The light grey vertical dashed lines indicate the median composite risk score of 0.74.
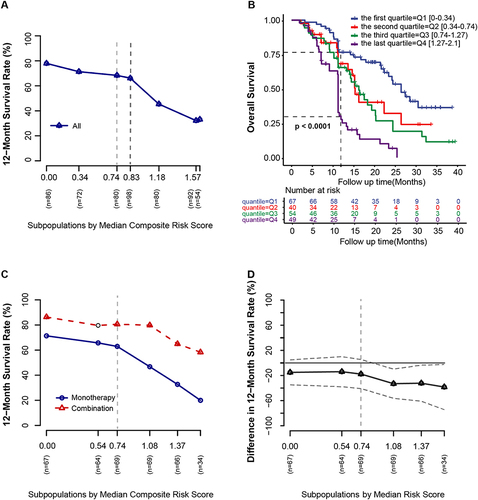
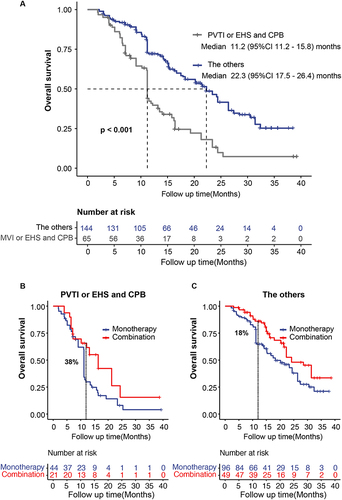
Figure 4 The lenvatinib plus anti-PD-1 made overall survival improvement. (A) Overall survival grouping by PVTI or EHS combined with CPB. (B) For patients with PVTI or EHS combined with CPB, lenvatinib plus anti-PD-1 made overall survival improvement, (C) while, for the others, it did.