Figures & data
Table 1 SEER 5-Year Age-Adjusted Incidence Rates for the ten Most Common Types of Cancer from 2015–2019
Figure 1 Ten most frequent cancer sites in the US population per race/ethnicity. Cancer sites displayed from top to bottom: prostate, breast, lung and bronchus, colon and rectum, melanoma, urinary bladder, kidney and renal pelvis, pancreas, liver, endometrial. NHW=non-Hispanic white individuals, NHB=non-Hispanic black individuals. Rates are per 100,000 and age-adjusted to the 2000 US Std Population (19 age groups–- Census P25-1130) standard. Data acquired from SEER database for 2015–2019.
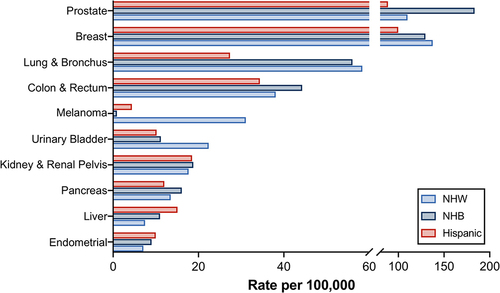
Figure 2 Incidence Rate-Ratio relative to non-Hispanic White individuals by race/ethnicity. Ratio of cancer incidence in (A) Hispanic individuals, (B) non-Hispanic black individuals (NHB), (C) non-Hispanic Asian/pacific islander individuals (NH A/PI), and (D) non-Hispanic American Indian/Alaska Native (NH AI/AN) individuals compared to non-Hispanic white individuals. Rates are per 100,000 and age-adjusted to the 2000 US Std Population (19 age groups–- Census P25-1130) standard sourced from SEER database.
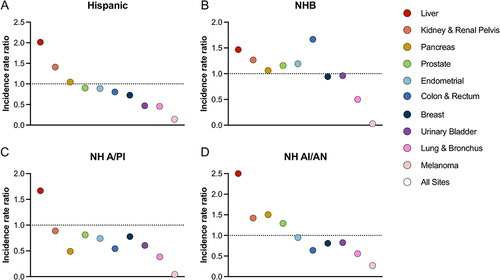
Figure 3 Incidence and mortality rate of liver cancer by race/ ethnicity. (A) Incidence and (B) mortality rates per 100,000 cases from CDC USCS database for non-Hispanic white (NHW) individuals, non-Hispanic black (NHB) individuals, and Hispanic individuals.
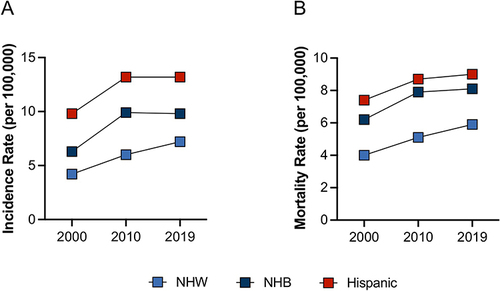
Figure 4 Consort diagram. Specific search terms and filters yielded 389 studies using PubMed (National Library of Medicine), Embase (Elsevier), and Web of Science: Core Collection (Clarivate Analytics) for multinational phase III clinical oncology trials of patients with liver cancer. These were further filtered to exclude non-interventional trials or trials that were phase I II or IV (manual verification), yielding 17 studies. Thirteen of those studies sufficiently reported data on race and ethnicity.
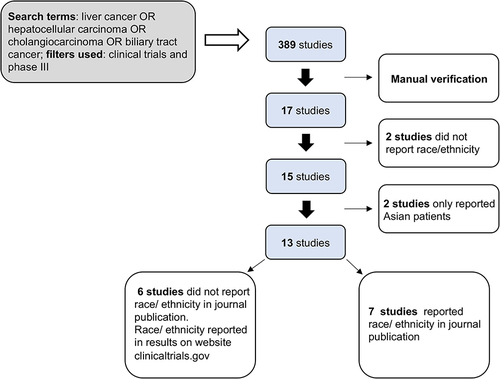
Table 2 Multinational Phase III Clinical Trials of Liver Cancer in the Last 10 Years by Race/Ethnicity of Trial Participants
Figure 5 Multinational Studies of Liver Cancer from 2012–2022 per Race/ Ethnicity. Relative size of pie chart shows relative number of participants. Inner circles display information on ethnicity, outer circles display information on race.
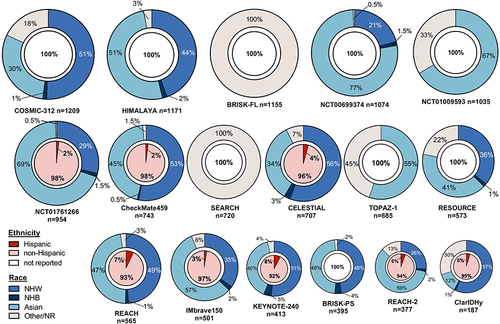
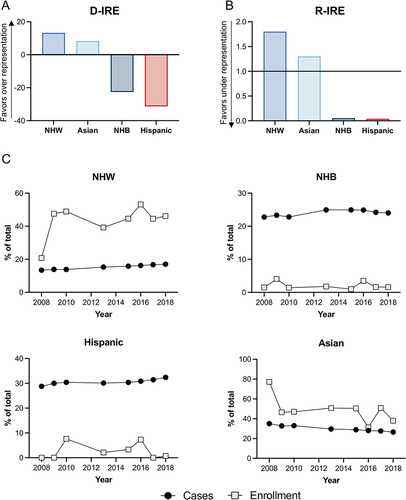
Figure 6 Underrepresentation of Hispanic individuals in clinical trials for liver cancer. (A) difference in incident rate ratio (D-IRE) by race and ethnicity and (B) the ratio of incidence by race and ethnicity (R-IRE) for non-Hispanic white (NHW) individuals, non-Hispanic Asian/pacific islander (NH A/PI) individuals, non-Hispanic black (NHB) individuals, and Hispanic individuals. (C) number of liver cancer cases by race/ethnicity over time and proportion of participants enrolled in clinical trials for liver cancer over time.