
Figures & data
Table 1 Baseline Characteristics of the Enrolled Patients
Table 2 Characteristics of the Derivation Cohort and Validation Cohort at Baseline
Table 3 Prognostic Factors Associated with PFS After TACE in Patients with HCC
Figure 1 A prognostic nomogram for PFS in patients with HCC after TACE. The nomogram included baseline indicators: Age, ALBI, PVTT; indicators of 1 month follow-up: NLR, the change of AFP and DCP; and the cumulative number of TACE in 6 months. *Compared with baseline, 0 indicates there was a change of decrease ≥20% in the outcome of the follow-up visit; 2 indicates there was a change of increase ≥20%; 1 indicates the change in the index follow-up outcome was between 0 and 2.
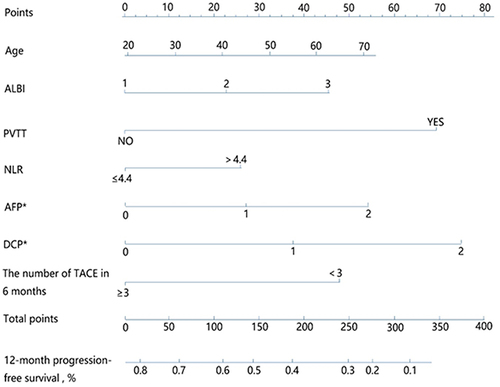
Figure 2 The calibration curves of the nomogram in the derivation and validation cohorts. (A) derivation cohort, (B) validation cohort. The nomogram-predicted probability of PFS is plotted on the x-axis, and the actual PFS is plotted on the y-axis.
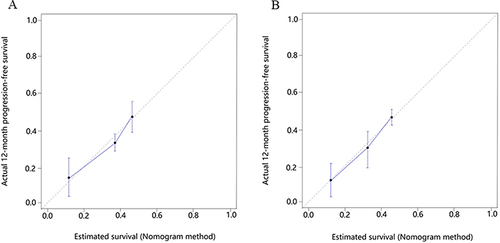
Table 4 Comparison of the Concordance Index Between the Constructed Nomogram and BCLC Stage for PFS Prediction in the Derivation and Validation Cohorts
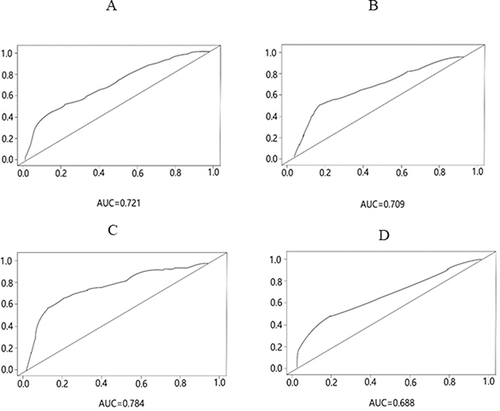
Figure 3 The ROC curve of the nomogram and BCLC for predicting 12-month PFS in the derivation and validation cohorts. The ROC curve of the (A) nomogram in the derivation cohort, (B) BCLC in the derivation cohort, (C) nomogram in the validation cohort, and (D) BCLC in the validation cohort, for predicting 12-month PFS.
Data Sharing Statement
All data in the study are included in the published article.