Figures & data
Table 1 The Information of Antibodies Used in the Present Experiment
Table 2 The Detailed Information of the Primer Sequences Used in Real-Time Quantitative-Polymerase Chain Reaction
Table 3 Clinical Characteristics of the HCC Patients Used in This Study
Figure 1 Differences in expression of CSTF2, PDE2A, and gene pair CSTF2/PDE2A between HCC tissue and adjacent normal tissue. The expression of (A) CSTF2, (C) PDE2A, (E) CSTF2/PDE2A in TCGA cohort. The expression of (B) CSTF2, (D) PDE2A, (F) CSTF2/PDE2A in ICGC cohort.
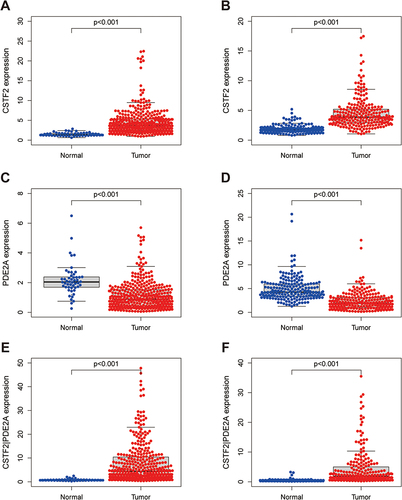
Figure 2 Survival analysis and time-dependent ROC curves of CSTF2, PDE2A, and gene pair CSTF2/PDE2A for OS in HCC. The optimal cut-off value of (A) CSTF2 expression, (B) PDE2A expression, and (C) CSTF2/PDE2A expression in HCC patients. Kaplan–Meier curves for OS of patients in the TCGA cohort with high and low (D) CSTF2 expression, (E) PDE2A expression, and (F) CSTF2/PDE2A expression. Kaplan–Meier curves for OS of patients in the ICGC cohort with high and low (G) CSTF2 expression, (H) PDE2A expression, and (I) CSTF2/PDE2A expression. Time-dependent ROC curves of CSTF2, PDE2A and gene pair CSTF2/PDE2A at (J) 1-year, (K) 2-year, and (L) 3-year OS in the TCGA cohort. Time-dependent ROC curves of CSTF2, PDE2A and gene pair CSTF2/PDE2A at (M) 1-year, (N) 2-year, and (O) 3-year OS in the ICGC cohort.
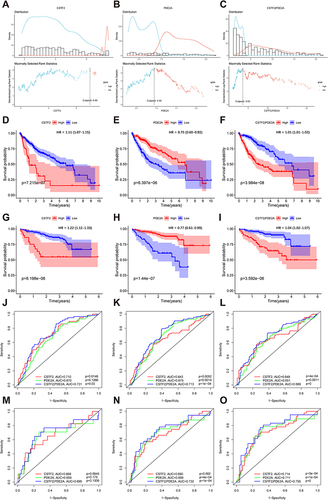
Figure 3 Univariate and multivariate Cox regression analysis for the prediction of OS probability and the AUC of clinical characteristics and gene pair CSTF2/PDE2 for OS. (A) Univariate and (B) multivariate Cox regression analyses to screen OS-related factors in the TCGA cohort. (C) Univariate and (D) multivariate Cox regression analyses to screen OS-related factors in the ICGC cohort. The AUC of clinical characteristics and CSTF2/PDE2 at (E) 1-year, (F) 2-year, and (G) 3-year OS in the TCGA cohort. The AUC of clinical characteristics and CSTF2/PDE2 at (H) 1-year, (I) 2-year, and (J) 3-year OS in the ICGC cohort.
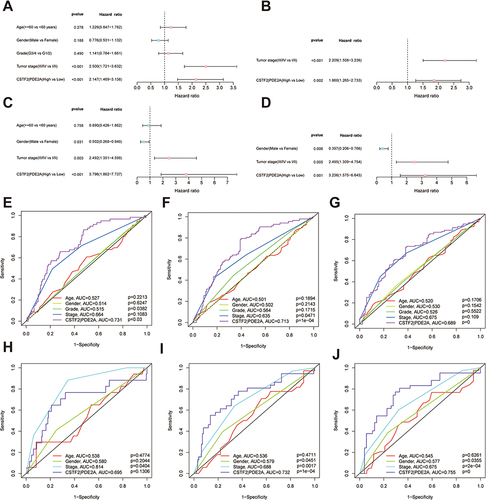
Figure 4 The expression of CSTF2/PDE2A in different groups stratified by clinical characteristics. TCGA cohort (A–D), ICGC cohort (E–G). (A and E) Age, (B and F) Gender, (C and G) Tumor stage, (D) Tumor grade.
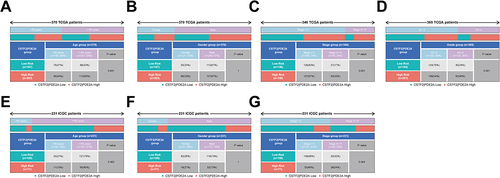
Figure 5 The nomogram models for OS and their calibration and ROC curves. Nomogram models combining the CSTF2/PDE2A and clinicopathological features for predicting the OS probability of HCC patients from (A) TCGA cohort and (B) the ICGC cohort. The calibration plots for the OS nomogram model at (C) 1-year, (D) 2-year, and (E) 3-year OS in the TCGA cohort. The calibration plots for the OS nomogram model at (F) 1-year, (G) 2-year, and (H) 3-year OS in the ICGC cohort. The ROC curves of OS nomogram model at (I) 1-year, (J) 2-year, and (K) 3-year OS in the TCGA cohort. The ROC curves of OS nomogram model at (L) 1-year, (M) 2-year, and (N) 3-year OS in the ICGC cohort.
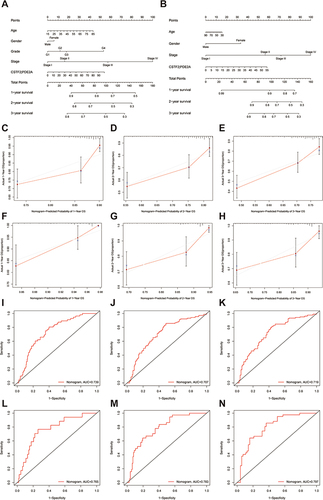
Figure 6 The immune status between high and low groups and the relationship of CSTF2/PDE2A with tumor purity. TCGA cohort (A and B), ICGC cohort (C and D). (A and C) The scores of 9 immune cells and related functions. (B and D) The association of CSTF2/PDE2A with tumor purity. P values are showed as: *P < 0.05; **P < 0.01; ***P < 0.001.
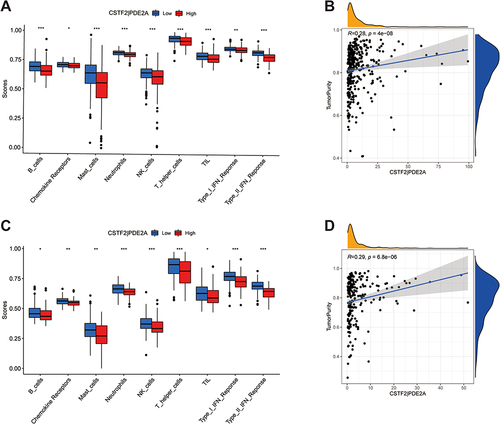
Figure 7 Gene set enrichment analysis of biological function and pathway. (A, C and E) TCGA cohort, (B, D and F) ICGC cohort. (A and B) GO, Gene Ontology. (C and D) KEGG, Kyoto Encyclopedia of Genes and Genomes. (E and F) The scores of 15 cell cycle-related genes.
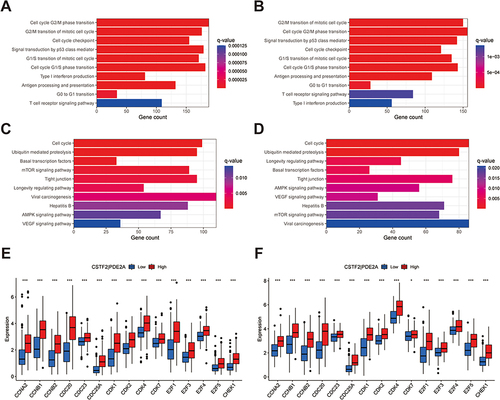
Figure 8 Scatter plots of the association between the gene pair CSTF2/PDE2A expression and anti-tumor drugs sensitivity. (A)Erlotinib, (B) Staurosporine, (C) Pyrazoloacridine, (D) Sonidegib, (E) Triciribine phosphate.
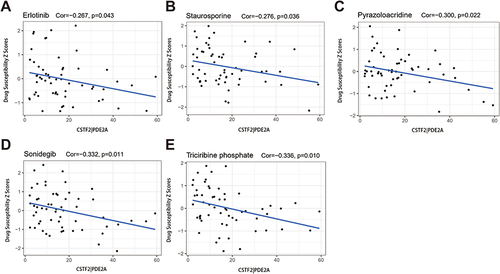
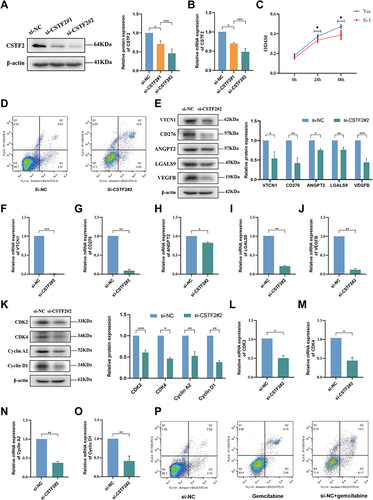
Figure 9 Cell experiments presenting the effect of CSTF2 knockdown in HCC cells. The efficiency of si-CSTF2 transfection in Huh7 cells was validated by (A) Western blot and (B) RT-qPCR (n = 3). (C) Cell viability assay was determined using CCK8 (n = 3). (D) Cell apoptosis was detected in Huh7 cells. (E) The protein levels of VTCN1, CD276, ANGPT2, LGALS9, and VEGFB in Huh7 cells were analyzes by Western blot (n = 3). (F–J) The mRNA levels of VTCN1, CD276, ANGPT2, LGALS9, and VEGFB in Huh7 cells were analyzed by RT-qPCR (n = 3). (K) Western blotting analysis of CDK2, CDK4, Cyclin A2, and Cyclin D1 in Huh7 cells (n = 3). (L–O) The relative mRNA expression of CDK2, CDK4, Cyclin A2, and Cyclin D1 in Huh7 cells was analyzed using RT-qPCR (n = 3). (P) The sensitivity of the Huh7 cells to gemcitabine. P values are showed as: *P < 0.05; **P < 0.01; ***P < 0.001.