Figures & data
Figure 1 Calculation of the Naples Prognostic Score.
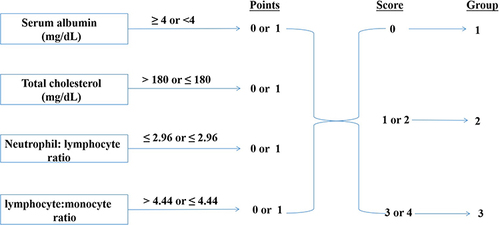
Table 1 Comparisons of Clinical Characteristics Among the Three Groups According to Preoperative Naples Prognostic Score
Figure 2 Curves comparisons of overall survival and recurrence free survival among each group (calculated by Log rank test). Group 1 (NPS = 0); Group 2 (NPS = 1 or 2), and Group 3 (NPS = 3 or 4), respectively. (A) Overall survival, (B) Recurrence-free survival.
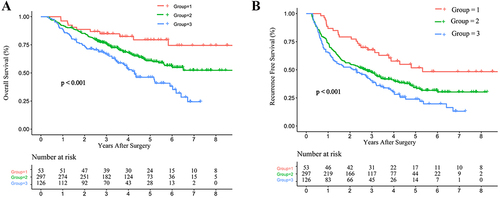
Table 2 Univariable and Multivariable Cox Regression Analyses of Risk Factors Associated with Overall Survival for HCC After Hepatectomy
Table 3 Univariable and Multivariable Cox Regression Analyses of Risk Factors Associated with Recurrence-Free Survival for HCC After Hepatectomy
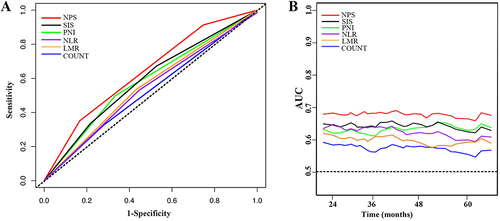
Figure 3 (A) Compared the predictive ability of postoperative overall survival at 5-year by time-dependent ROCs between the NPS scores and the other indicators. (B) Compared time-dependent AUCs between the NPS scores and the other indicators.