
Figures & data
Table 1 Baseline Characteristics of the ALR-Low, ALR-Intermediate and ALR-High Cohort
Table 2 Univariable and Multivariable Cox Regression Analyses of Prognostic Factors in Train Cohort
Figure 1 Restricted cubic spline analyses for Lym-R (a) and AST (b).
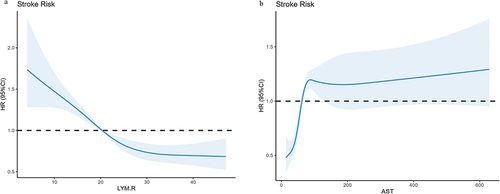
Figure 2 Kaplan-Meier survival curves according to ALR score. (a) Overall survival according to ALR points in the pooled cohort. (b) Training cohort. (c) Valid cohort. (d) TACE plus targeted therapy cohort.
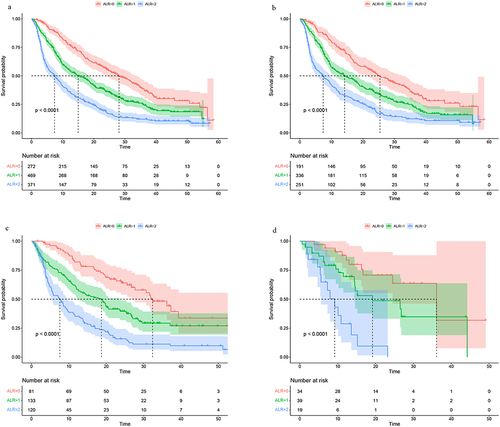
Figure 3 Time-dependent receiver operating characteristic curves of ALR score for overall survival in HCC patients. AUC area under the curve.
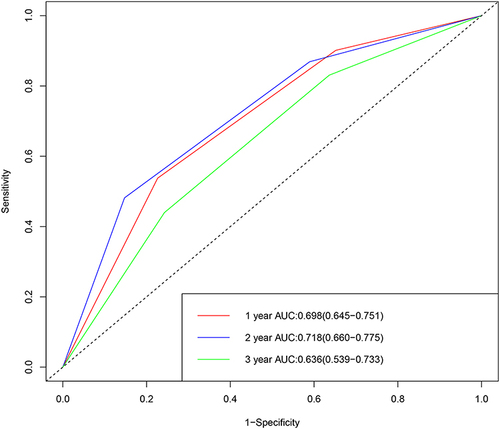
Figure 4 Nomogram used to evaluate survival.
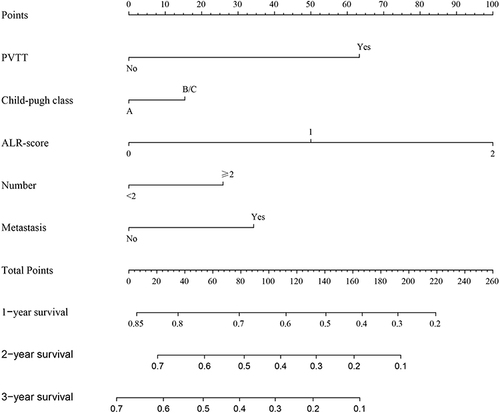
Table 3 Efficacy According to ALR Score in TACE Plus Targeted Therapy with Immunotherapy Set