Figures & data
Table 1 The Detailed Information About antibodies in This Research
Figure 1 The ZPR1 expression in pan-cancer. (A) ZPR1 expression in pan-cancer tissues from TCGA database. (B) ZPR1 expression in pan-cancer tissues based on TCGA and GTEx databases. (C) ZPR1 expression in paired tumor and adjacent normal tissues from TCGA database. (D) ZPR1 protein expression in pan-cancer tissues from the UALCAN-CPTAC database. ZPR1 mRNA expression in various tissues (E) and cancer cell lines (F) from the HPA database. (G) Cellular localization of ZPR1 from the HPA database. *p < 0.05; **p < 0.01; and ***p < 0.001.
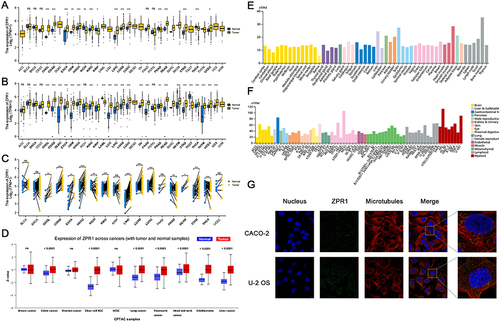
Figure 2 DNA methylation analysis of ZPR1. (A) Chromosomal distribution of the 14 methylation probes associated with ZPR1 on chromosome 11. (B)Detailed location of 14 probes in CpG Island. (C) ZPR1 methylation levels in tumor and normal samples cross different types of cancers. p > 0.05; *p <= 0.05; **p <= 0.01; ***p <= 0.001; ****p <= 0.0001.
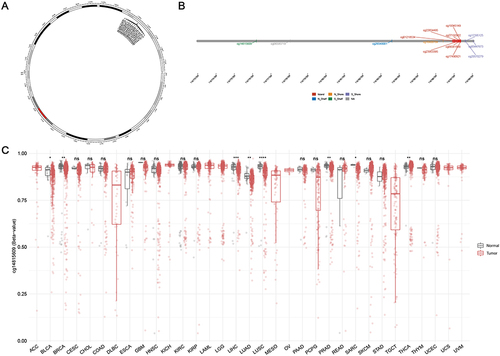
Figure 3 Clinical correlation analysis between the ZPR1 expression and patient’s age (A), gender (B), tumor status (C), pathological stage (D), TMB (E), MSI (F), and stemness (G) in pan-cancer. *p < 0.05; **p < 0.01; ***p < 0.001.
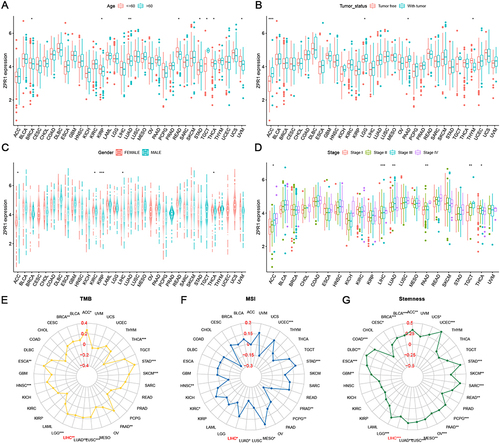
Table 2 The Prognostic Values of ZPR1 (RNAseq ID: 8882) Expression Stratified by Different Clinicopathologic Features from Kaplan-Meier Plotter Databases
Figure 4 ZPR1 could be considered as an independent predictor for HCC patient survival. (A) The difference of ZPR1 expression in HCC retrieved from the GENT2 database. (B) The heatmap showing the clinical correlation analysis of ZPR1 expression in HCC by the Chi-square test. (C) The overall survival analysis of ZPR1 in TCGA HCC samples. Univariate Cox analysis (D) and multivariate Cox analysis (E) of ZPR1 expression and clinicopathological characteristics. (F) The ROC curves of 1-year and 3-year OS of ZPR1. (G) Nomogram of ZPR1 expression and clinicopathological features. (H) The calibration curves of the nomogram for 1-year and 3-year OS.
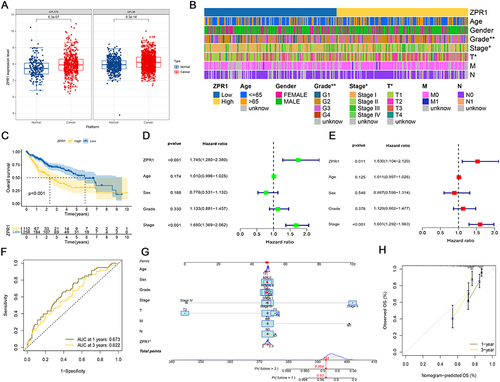
Figure 5 The functional prediction of the ZPR1 gene in HCC. (A) Co-expression analysis of ZPR1. (B) Target gene prediction through CHEA, ENCODE, and JASPAR databases. (C) Pearson correlation analysis between ZPR1 and predicted target gene. (D) Differential expression genes in high- and low-ZPR1 expression groups. (E and F) GO and KEGG analyses showing biological processes and molecular functions involved in ZPR1-related DEGs. (G) GSEA analysis showing cancer- or metabolism-related pathways enriched in high-ZPR1 groups.
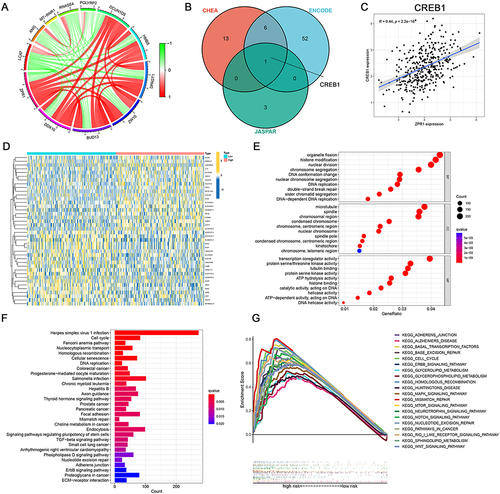
Figure 6 Immune landscape analysis of the ZPR1 gene. (A) TME score comparison in low- and high-ZPR1 groups. (B) The immune cell infiltration correlation analysis of the ZPR1 gene using the CIRBSORT algorithm. (C) The immune cell infiltration correlation analysis of the ZPR1 gene by multiple methods. (D) Correlation analysis between ZPR1 gene and immune checkpoint genes. (E and F) The correlation between the ZPR1 gene and immune cell infiltration scores or immune-related functions. *p < 0.05; **p < 0.01; ***p < 0.001.
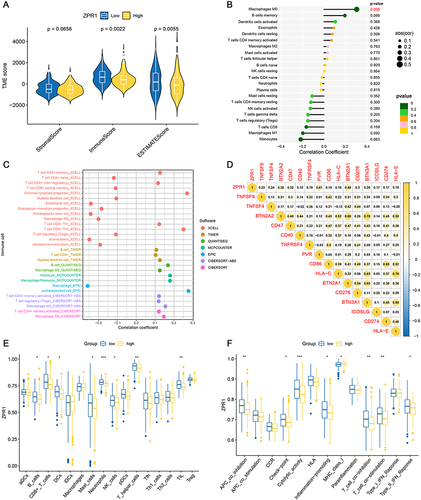
Figure 7 ZPR1 expression in TME-associated cells. Annotation of all cell types, ZPR1 expression percentages and differential expression in GSE125449 (A-C), GSE140228 (D-F), and GSE145409 (G-I) datasets. *p < 0.05; **p < 0.01; and ***p < 0.001.
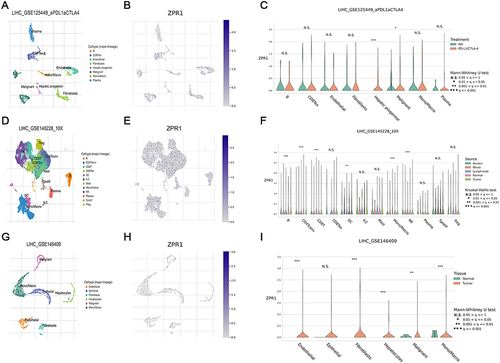
Figure 8 ZPR1 immunostaining in HCC tissue samples. ZPR1 immunostaining showing low expression in the cytoplasm of normal hepatocytes, and prominent positive expression in the cytoplasm of HCC cells. (A) The ZPR1 expression between HCC cells and adjacent normal hepatocytes in the same visual field (200 ×). (B) The H-score difference of ZPR1 expression in HCC tissues. (C and D) Correlation between ZPR1 expression and common immune cell markers, as well as PD-L1. (E) The AUC value for tumor diagnosis of ZPR1. (F) Correlation analysis of ZPR1 expression with clinicopathological characteristics.
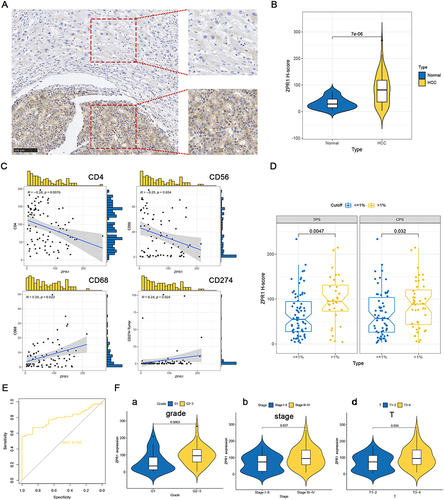
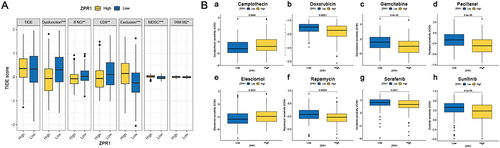
Figure 9 Treatment response prediction of ZPR1. (A) TIDE score prediction (B) The IC50 difference of common chemotherapeutic or targeted drugs in low- and high-ZPR1 expression groups. *p < 0.05; **p < 0.01; ***p < 0.001.