Figures & data
Table 1 Association Between AC006329.1 Expression and the Clinicopathological Features of Patients with Hepatocellular Carcinoma.(n = 50)
Table 2 The Cox Proportional Hazards Model of the Relationship Between AC006329.1 Expression and Clinicopathological Features of Hepatocellular Carcinoma
Figure 1 AC006329.1 is high expressed in HCC and correlated with poor prognosis. (A) The heatmap of sequencing results; (B) qRT-PCR results of AC006329.1 expression in 50 pairs of HCC and matched paracancerous normal tissues; (C) The expression of AC006329.1 in HCC cell lines and LO2 normal human hepatocytes; (D) Pan-cancerous analysis of the expression level of AC006329.1 in multiple cancerous tissues in TCGA database by LncCAR; (E) Kaplan-Meier survival curve of the relationship between the expression of AC006329.1 and DFS in HCC patients in TCGA database by GEPIA2; (F) Kaplan-Meier survival curve of the relationship between the expression of AC006329.1 and OS in HCC patients; (G) Subcellular localization map of AC006329.1 in LncLocator database; (H) Detection of subcellular localization of AC006329.1 by qRT-PCR; (I and J) The transfection efficiency of ov-AC006329.1 plasmids and si-AC006329.1 in Hep-3B and MHCC-LM3 cells. (**P < 0.01, ***P < 0.001, ****P<0.0001).
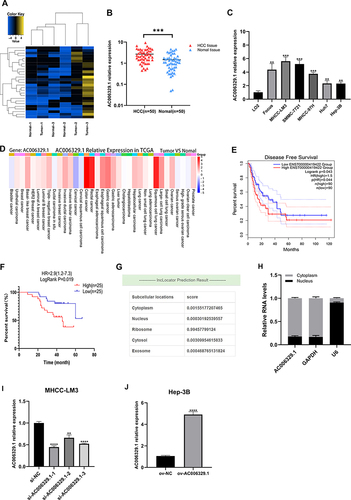
Figure 2 AC006329.1 promoted the proliferation, migration, invasion and epithelial-mesenchymal transformation (EMT) of HCC cells in vitro. (A–C) Colony formation assay to evaluate the proliferative ability of MHCC-LM3 cells(si-AC006329.1, si-NC) and Hep-3B cells(ov-AC006329.1, ov-NC); (D and E) CCK-8 assay to evaluate the proliferative ability of MHCC-LM3 cells(si-AC006329.1, si-NC) and Hep-3B cells(ov-AC006329.1, ov-NC); (F–H) EDU assay to evaluate the proliferative ability of MHCC-LM3 cells(si-AC006329.1, si-NC) and Hep-3B cells(ov-AC006329.1, ov-NC); Scale bar represents 25 µm. (I–K) Wound healing assay to evaluate the migration ability of MHCC-LM3 cells(si-AC006329.1, si-NC) and Hep-3B cells(ov-AC006329.1, ov-NC); Scale bar represents 100 µm. (L–N) 3D Spheroid Invasion assay to evaluate the invasive ability of MHCC-LM3 cells(si-AC006329.1, si-NC) and Hep-3B cells(ov-AC006329.1, ov-NC); Scale bar represents 50 µm. (O–Q) Transwell assay to evaluate the migration ability of MHCC-LM3 cells(si-AC006329.1, si-NC) and Hep-3B cells(ov-AC006329.1, ov-NC); Scale bar represents 100 µm. (R and S) The expressions of E-cadherin, N-cadherin and vimentin in MHCC-LM3 cells(si-AC006329.1, si-NC) and Hep-3B cells(ov-AC006329.1, ov-NC) were detected by EMT experiment (Scale bar represents 25 µm) and Western blot experiment. (***P < 0.001).
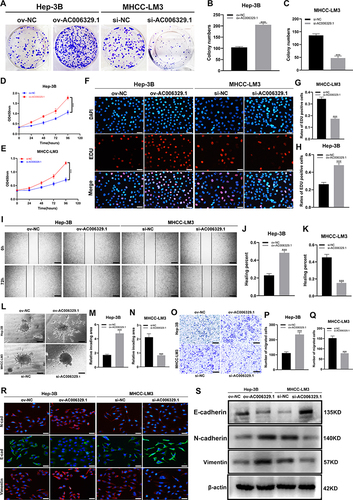
Figure 3 AC006329.1 adsorbsed miR-127-5p by sponge through ceRNA action in HCC. (A) Venn diagram drawn by taking the intersection of two databases of LncBase and miRDB; (B) The volcano map of differentially expressed miRNA between HCC samples (n = 307) and normal liver tissues (n = 50) in TCGA-LIHC database was selected by OncomiRDB and according to the threshold value (p < 0.05 and | Log2 (FoldChange) | > 1); (C) Venn diagram of low expression of miRNA in liver cancer tissues in TCGA-LIHC database; (D and E) The target miRNA was screened by qRT-PCR; (F) Expression of miR-127-5p in 50 pairs of HCC tissues and normal paracancerous tissues via qRT-PCR; (G) Pearson correlation analysis of the expression levels of AC006329.1 and miR-127-5p in 50 pairs of HCC tissues; (H) Expression levels of miR-127-5p in HCC cell lines and LO2 normal human liver cell lines; (I) The binding sites between AC006329.1 and miR-127-5p were predicted by miRDB; (J) Luciferase activity was measured in HEK-293T cells cotransfected with AC006329.1-wt or AC006329.1-Mut luciferase plasmid and miR-127-5p mimic or mi-NC; (K) Pan-cancerous analysis of miR-127-5p expression in cancer tissues in TCGA database by CancerMIRNome; (L) The boxplot for analyzing the expression level of miR-127-5p in HCC tissues from TCGA database by CancerMIRNome; (M) The receiver operating characteristic (ROC) curve was obtained by analyzing the expression level of miR-127-5p in patients with HCC in TCGA-LIHC database by CancerMIRNome. The area under the curve (AUC) was 0.78; (N and O) The transfection efficiency of mi-miR-127-5p plasmids and in-miR-127-5p in MHCC-LM3 and Hep-3B cells. (ns: P >0.05, *P < 0.05, **P < 0.01, ***P < 0.001).
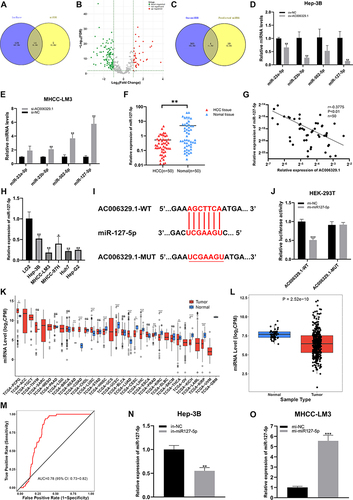
Figure 4 miR-127-5p inhibits the proliferation, migration and invasion of HCC cells in vitro. (A–C) Colony formation assay was used to detect the proliferation ability of Hep-3B cells (in-NC, in-miR-127-5p) and MHCC-LM3 cells (mi-NC, mi-miR-127-5p); (D and E) CCK-8 assay was used to detect the proliferation of Hep-3B cells (in-NC, in-miR-127-5p) and MHCC-LM3 cells (mi-NC, mi-miR-127-5p); (F–H) EDU assay was used to detect the proliferation ability of Hep-3B cells (in-NC, in-miR-127-5p) and MHCC-LM3 cells (mi-NC, mi-miR-127-5p); Scale bar represents 25 µm. (I-K) Wound healing assay was used to detect the migration of Hep-3B cells (in-NC, in-miR-127-5p) and MHCC-LM3 cells (mi-NC, mi-miR-127-5p); Scale bar represents 100 µm. (L–N) 3D Spheroid Invasion assay was used to detect the invasiveness of Hep-3B cells (in-NC, in-miR-127-5p) and MHCC-LM3 cells (mi-NC, mi-miR-127-5p); Scale bar represents 50 µm. (O–Q) Transwell assay was used to detect the migration of Hep-3B cells (in-NC, in-miR-127-5p) and MHCC-LM3 cells (mi-NC, mi-miR-127-5p); Scale bar represents 100 µm. (R and S) EMT(Scale bar represents 25 µm) and Western blotting were used to detect the protein expression of E-cadherin, N-cadherin and vimentin in Hep-3B cells (in-NC, in-miR-127-5p) and MHCC-LM3 cells (mi-NC, mi-miR-127-5p). (**P < 0.01, ***P < 0.001).
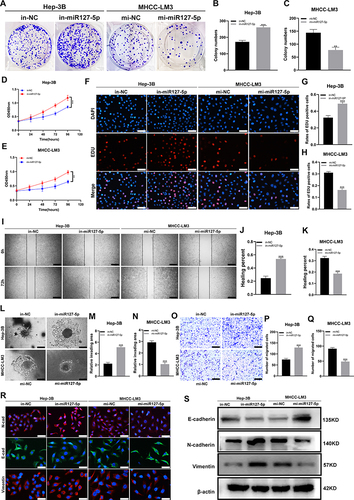
Figure 5 SHC3 is a target gene of miR-127-5p. (A) Venn diagram analysis showed that SHC3 can be a target gene of miR-127-5p by four databases; (B) Volcano plot of differentially expressed mRNA in the TCGA-LIHC database. Red dots represent up-regulated mRNAs and blue dots represent down-regulated mRNAs in HCC tissues (threshold, p-value < 0.05 and |log2FoldChange| > 1); (C) Venn diagram was drawn to screen out mRNA with high expression in HCC tissues from TCGA database; (D) Pan-cancer analysis of the expression level of SHC3 in cancer tissues in TCGA database by Timer1.0; (E) Kaplan-Meier survival curve of the relationship between the expression of SHC3 and OS in HCC patients; (F) The expression of SHC3 in 50 pairs of HCC tissues and matched normal adjacent tissues via qRT-PCR; (G) The expression of SHC3 in 3 pairs of HCC and paracancer tissues was detected by WB assay; (H) Pearson correlation analysis was used to analyze the correlation between miR-127-5p and SHC3 in 50 pairs of HCC tissues; (I) Correlation analysis of the expression level of SHC3 and AC006329.1 in liver cancer tissues in TCGA database by GEPIA2; (J) The binding sites between miR-127-5p and SHC3 were predicted by starBase; (K) Luciferase activity was measured in HEK-293T cells cotransfected with SHC3-wt or SHC3-Mut luciferase plasmid and miR-127-5p mimic or mi-NC; (L) Spearman correlation analysis of SHC3 expression level and EMT marker expression (i), extracellular matrix related gene expression (ii) and extracellular matrix degradation level (iii) based on TCGA database; (M) Biocarta pathway enrichment analysis of AC006329.1 through starbase database; (N) Correlation analysis of expression levels of SHC3, ERK1 and ERK2 in TCGA database by GEPIA2. (**P < 0.01, ***P < 0.001,).
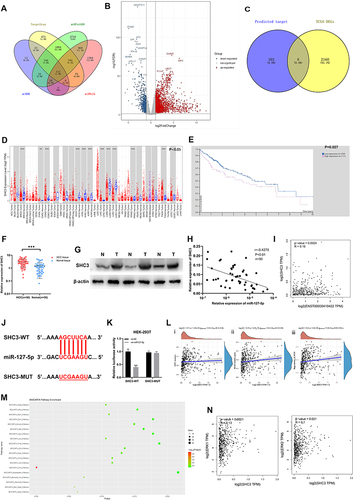
Figure 6 AC006329.1 promoted HCC by regulating the miR-127-5p/SHC3/ERK axis. (A and B) Colony formation assay showed that both mi-miR-127-5p and si-SHC3 reversed the enhancement of ov-AC006329.1 in HCC cell proliferation; (C) CCK-8 assay showed that both mi-miR-127-5p and si-SHC3 reversed the enhancement of ov-AC006329.1 in HCC cell proliferation; (D and E) EDU assay showed that both mi-miR-127-5p and si-SHC3 reversed the enhancement of ov-AC006329.1 in HCC cell proliferation; Scale bar represents 25 µm. (F and G) Wound healing assay showed that both mi-miR-127-5p and si-SHC3 reversed the enhancement of ov-AC006329.1 in HCC cell proliferation; Scale bar represents 100 µm. (H–J) 3D Spheroid Invasion assay and transwell assay showed that both mi-miR-127-5p and si-SHC3 reversed the enhancement of ov-AC006329.1 in HCC cell invasion and migration; Scale bar represents 50 µm. (K) The protein expression of E-cadherin, N-cadherin and vimentin was measured by EMT assay; Scale bar represents 25 µm. (L) The protein expression of E-cadherin, N-cadherin, vimentin, SHC3 and p-ERK was measured by and Western blotting assay in Hep-3B cells. (*P<0.05, **P < 0.01, ***P < 0.001).
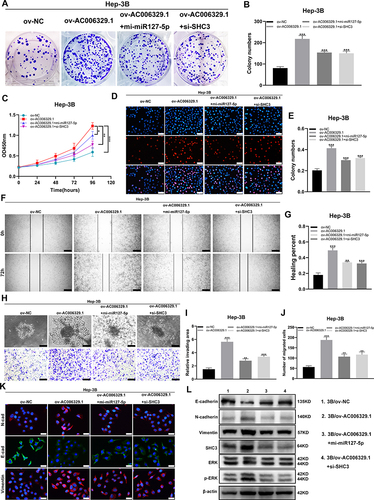
Figure 7 AC006329.1 promoted the progression and metastasis of HCC cells in vivo. (A) Photos of subcutaneous tumors in different groups of nude mice; Scale bar represents 100 µm. (B) Histogram of final weight of subcutaneous tumors in four groups of nude mice; (C) Volume growth curves of subcutaneous tumors in four groups of nude mice; (D)The expression levels of Ki67 and SHC3 in subcutaneous tumor tissues of four groups detected by hematoxylin and eosin staining and immunohistochemistry; (E) H&E staining images of lung metastasis of nude mice injected with Hep-3B cells in the above four groups; Scale bar represents 100 µm; (F) The number of lung metastatic nodules in the above four groups. (**P < 0.01, ***P < 0.001).
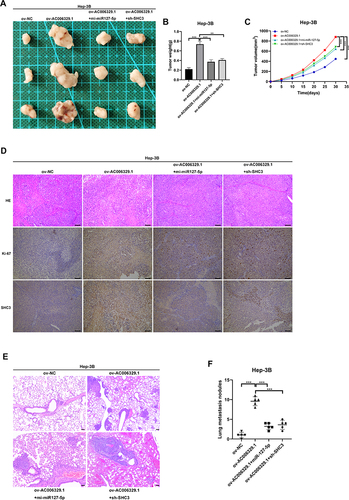
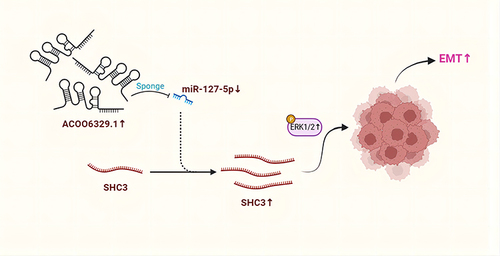
Figure 8 A simple pattern of targeted regulation of miR-127-5p/SHC3/ERK axis by AC006329.1 to promote the occurrence and development of HCC.