Figures & data
Figure 1 ATP8B1-AS1 is upregulated and correlated with poor overall survival in HCC. (A) The correlation between ATP8B1-AS1 (RP11-35G9.3) expression and overall survival in HCC based on TCGA-LIHC RNA-seq data, analyzed by GEPIA. (B) ATP8B1-AS1 expression in HCC tissues (n = 371) and normal liver tissues (n = 50), based on TCGA-LIHC RNA-seq data. (C) ATP8B1-AS1 expression in HCC tissues with grade 1–2 (n = 232) or grade 3–4 (n = 134), based on TCGA-LIHC RNA-seq data. (D) ATP8B1-AS1 expression in HCC tissues with AFP level ≤ 400 (n = 213) or > 400 (n = 65), based on TCGA-LIHC RNA-seq data. For (B–D), P values were calculated by Mann–Whitney test. (E) ATP8B1-AS1 expression in 79 pairs of HCC tissues and matched adjacent liver tissues was measured by qPCR. P values were calculated by Wilcoxon matched-pairs signed rank test. (F) Kaplan-Meier survival curve of our HCC cohort stratified by ATP8B1-AS1 expression level. Median ATP8B1-AS1 expression level was used as cut-off. n = 79, HR = 1.920, P = 0.0314 by Log rank test. (G) ATP8B1-AS1 expression in immortalized liver cell line THLE-2 and HCC cell lines HuH-7, SNU-398, and SK-HEP-1 was detected by qPCR. Results are presented as mean ± SD based on three independent experiments. ****P < 0.0001 by one-way ANOVA followed by Dunnett’s multiple comparisons test.
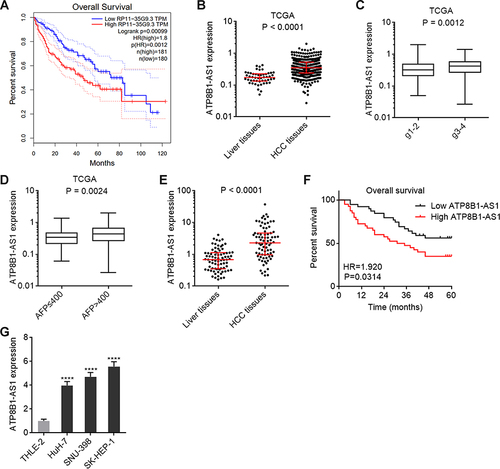
Figure 2 m6A modification increases the stability of ATP8B1-AS1 transcript. (A) The correlation between ATP8B1-AS1 expression and METTL3 expression, based on TCGA-LIHC RNA-seq data. r = 0.4780, P < 0.0001 by Spearman correlation analysis. (B) The correlation between ATP8B1-AS1 expression and WTAP expression, based on TCGA-LIHC RNA-seq data. r = 0.2894, P < 0.0001 by Spearman correlation analysis. (C) MeRIP assays using m6A specific antibody, followed by qPCR to detect m6A-modified ATP8B1-AS1. (D) The m6A modification site of ATP8B1-AS1, predicted by SRAMP. (E) Schematic of SELECT to detect m6A modification level. (F) The m6A modification level of ATP8B1-AS1 in METTL3 or FTO overexpressed HuH-7 and SNU-398 cells was detected by SELECT. (G and H) The stability of ATP8B1-AS1 transcript over time in METTL3 or FTO overexpressed HuH-7 (G) and SNU-398 (H) cells was detected after blocking new RNA synthesis using α-amanitin (50 µM) and normalized to 18S rRNA (a product of RNA polymerase I that is unchanged by α-amanitin). For (C) and (F–H), results are presented as mean ± SD based on three independent experiments. *P < 0.05, **P < 0.01, ***P < 0.001, ****P < 0.0001 by one-way ANOVA followed by Dunnett’s multiple comparisons test.
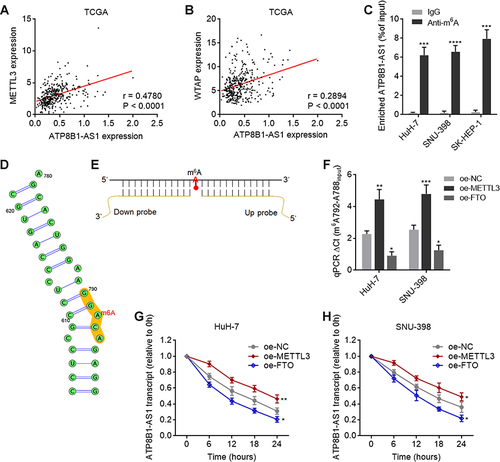
Figure 3 m6A modification level of ATP8B1-AS1 is upregulated and correlated with poor overall survival in HCC. (A) m6A modification level of ATP8B1-AS1 in 79 pairs of HCC tissues and matched adjacent liver tissues was detected by SELECT. P < 0.0001 by Wilcoxon matched-pairs signed rank test. (B) Kaplan-Meier survival curve of our HCC cohort stratified by m6A modification level of ATP8B1-AS1. Median m6A modification level of ATP8B1-AS1 was used as cut-off. n = 79, HR = 2.312, P = 0.0056 by Log rank test. (C) The correlation between m6A modification level of ATP8B1-AS1 and ATP8B1-AS1 expression level in HCC tissues, n = 79, r = 0.4022, P = 0.0002 by Spearman correlation analysis. (D) m6A modification level of ATP8B1-AS1 in immortalized liver cell line THLE-2 and HCC cell lines HuH-7, SNU-398, and SK-HEP-1 was detected by SELECT. Results are presented as mean ± SD based on three independent experiments. **P < 0.01, ***P < 0.001 by one-way ANOVA followed by Dunnett’s multiple comparisons test.
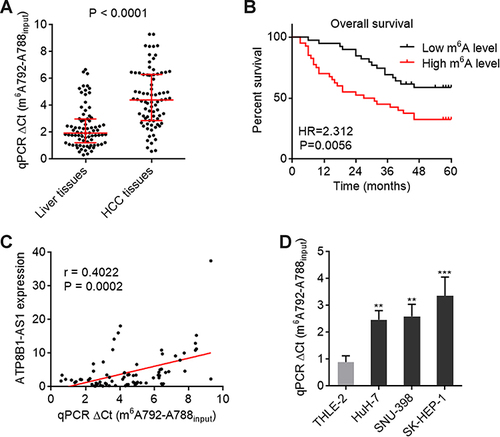
Figure 4 ATP8B1-AS1 exerts oncogenic roles in HCC in an m6A dependent manner. (A and B) ATP8B1-AS1 expression in SNU-398 (A) and HuH-7 (B) cells with wild-type or m6A-modified 792 site mutated ATP8B1-AS1 overexpression was measured by qPCR. (C and D) Cell proliferation of SNU-398 (C) and HuH-7 (D) cells with wild-type or mutated ATP8B1-AS1 overexpression was measured by Glo cell viability assay. (E) Cell proliferation of SNU-398 and HuH-7 cells with wild-type or mutated ATP8B1-AS1 overexpression was measured by EdU incorporation assays. Red color represents EdU-positive and proliferative cells. Scale bars = 100 µm. (F) Cell migration of SNU-398 and HuH-7 cells with wild-type or mutated ATP8B1-AS1 overexpression was measured by transwell migration assays. Scale bars = 100 µm. (G) Cell invasion of SNU-398 and HuH-7 cells with wild-type or mutated ATP8B1-AS1 overexpression was measured by transwell invasion assays. Scale bars = 100 µm. Results are presented as mean ± SD based on three independent experiments. *P < 0.05, **P < 0.01, ****P < 0.0001, by one-way ANOVA followed by Dunnett’s multiple comparisons test.
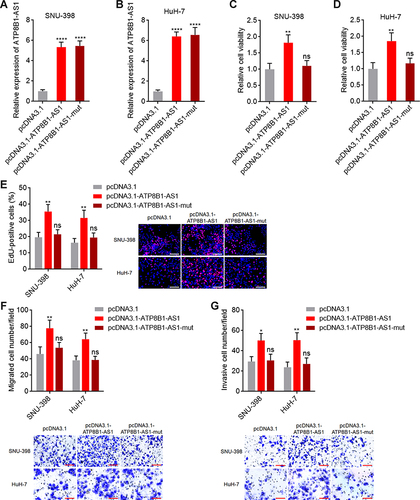
Figure 5 Depletion of ATP8B1-AS1 exerts tumor suppressive roles in HCC. (A and B) ATP8B1-AS1 expression in SNU-398 (A) and SK-HEP-1 (B) cells with ATP8B1-AS1 depletion was measured by qPCR. (C and D) Cell proliferation of SNU-398 (C) and SK-HEP-1 (D) cells with ATP8B1-AS1 depletion was measured by Glo cell viability assay. (E) Cell proliferation of SNU-398 and SK-HEP-1 cells with ATP8B1-AS1 depletion was measured by EdU incorporation assays. Red color represents EdU-positive and proliferative cells. Scale bars = 100 µm. (F) Tumor volume, weight, and photograph of subcutaneous tumors formed by SNU-398 cells with ATP8B1-AS1 depletion. (G) Cell migration of SNU-398 and SK-HEP-1 cells with ATP8B1-AS1 depletion was measured by transwell migration assays. Scale bars = 100 µm. (H) Cell invasion of SNU-398 and SK-HEP-1 cells with ATP8B1-AS1 depletion was measured by transwell invasion assays. Scale bars = 100 µm. Results are presented as mean ± SD based on three independent experiments (A–E, G and H) or n=5 mice in each group (F). *P < 0.05, **P < 0.01, ***P < 0.001, ****P < 0.0001 by one-way ANOVA followed by Dunnett’s multiple comparisons test (A–E, G and H) or Mann–Whitney test (F).
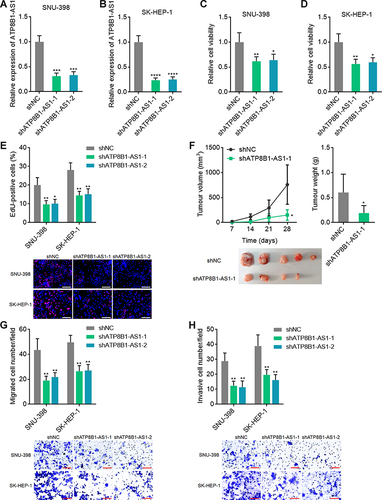
Figure 6 GSEA shows the correlation between ATP8B1-AS1 expression and MYC signaling activation. TCGA-LIHC samples were divided into ATP8B1-AS1 high expression and low expression group according to median ATP8B1-AS1 expression level. GSEA shows the positive correlation between ATP8B1-AS1 high expression and liver cancer subclass S2 gene signatures (A). MYC-bound genes were enriched in ATP8B1-AS1 high expression group (B). Genes upregulated by MYC were enriched in ATP8B1-AS1 high expression group, and genes downregulated by MYC were enriched in ATP8B1-AS1 low expression group (C).
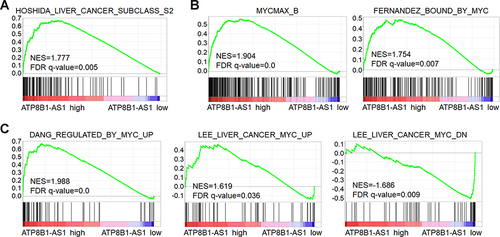
Figure 7 ATP8B1-AS1 epigenetically activates MYC expression in an m6A dependent manner. (A) The correlation between ATP8B1-AS1 and MYC expression, based on TCGA-LIHC RNA-seq data. r = 0.3206, P < 0.0001 by Spearman correlation analysis. (B) MYC expression in SNU-398 cells with wild-type or m6A-modified 792 site mutated ATP8B1-AS1 overexpression was measured by qPCR. (C) MYC expression in SNU-398 cells with ATP8B1-AS1 depletion was measured by qPCR. (D) ChIRP assays with ATP8B1-AS1 antisense probes or control probes were conducted in SNU-398 cells to measure the binding of ATP8B1-AS1 to MYC promoter or GAPDH promoter. GAPDH promoter was used as negative control. (E) ChIP assays with KDM3B or H3K9me2 specific antibodies were conducted in SNU-398 cells with wild-type or m6A-modified 792 site mutated ATP8B1-AS1 overexpression to measure the binding of KDM3B to MYC promoter and H3K9me2 level at MYC promoter. (F) ChIP assays with KDM3B or H3K9me2 specific antibodies were conducted in SNU-398 cells with ATP8B1-AS1 depletion to measure the binding of KDM3B to MYC promoter and H3K9me2 level at MYC promoter. (G) ChIP assays with KDM3B or H3K9me2 specific antibodies were conducted in SNU-398 cells with wild-type ATP8B1-AS1 overexpression and YTHDC1 silencing to measure the binding of KDM3B to MYC promoter and H3K9me2 level at MYC promoter. (H) MYC expression in SNU-398 cells with wild-type ATP8B1-AS1 overexpression and YTHDC1 silencing was measured by qPCR. (I) MYC expression in SNU-398 cells with wild-type ATP8B1-AS1 overexpression and KDM3B silencing was measured by qPCR. Results are presented as mean ± SD based on three independent experiments. **P < 0.01, ***P < 0.001, ****P < 0.0001, by one-way ANOVA followed by Dunnett’s multiple comparisons test (B–F) or two-tailed unpaired t-test (G–I).
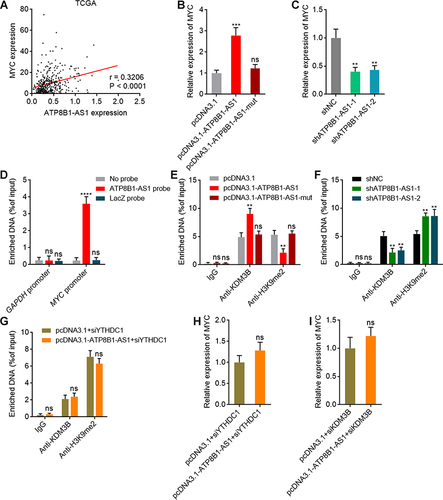
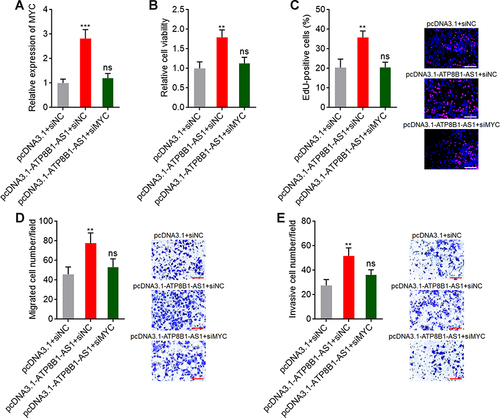
Figure 8 Depletion of MYC reverses the oncogenic roles of ATP8B1-AS1 in HCC. (A) MYC expression in SNU-398 cells with ATP8B1-AS1 overexpression and MYC silencing was measured by qPCR. (B) Cell proliferation of SNU-398 cells with ATP8B1-AS1 overexpression and MYC silencing was measured by Glo cell viability assay. (C) Cell proliferation of SNU-398 cells with ATP8B1-AS1 overexpression and MYC silencing was measured by EdU incorporation assays. Red color represents EdU-positive and proliferative cells. Scale bars = 100 µm. (D) Cell migration of SNU-398 cells with ATP8B1-AS1 overexpression and MYC silencing was measured by transwell migration assays. Scale bars = 100 µm. (E) Cell invasion of SNU-398 cells with ATP8B1-AS1 overexpression and MYC silencing was measured by transwell invasion assays. Scale bars = 100 µm. Results are presented as mean ± SD based on three independent experiments. **P < 0.01, ***P < 0.001, by one-way ANOVA followed by Dunnett’s multiple comparisons test.