
Figures & data
Table 1 Baseline Characteristics of the Patients Before and After PSM
Figure 1 Kaplan-Meier plots: The triple therapy group exhibited longer mOS and mPFS than that of the control group before (a and b) and after (c and d) PSM.
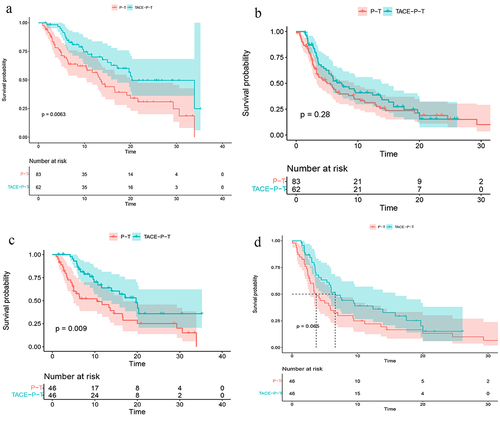
Table 2 Analyses of Prognostic Factors for Survival After PSM
Table 3 Analyses of Prognostic Factors for Progression-Free Survival After PSM
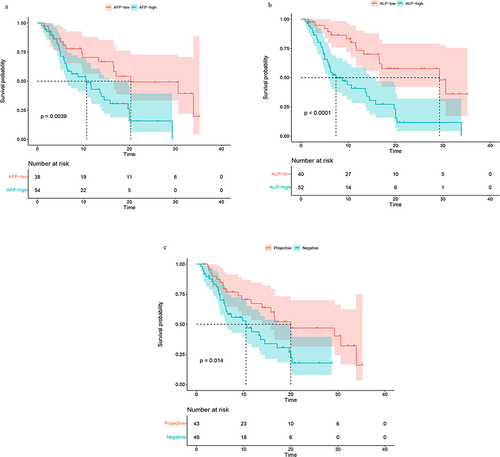
Figure 2 Survival curve of AFP (≥ 400ng/mL/<400ng/mL) group (a), ALP (≥ 125u/L/< 125u/L) group (b), PVTT group (c).
Data Sharing Statement
All data generated or analyzed during this study are included in this article. Further inquiries can be directed to the corresponding author (Lanpaoxiansheng @126.com).