
Figures & data
Figure 1 Patient Flow Diagram.
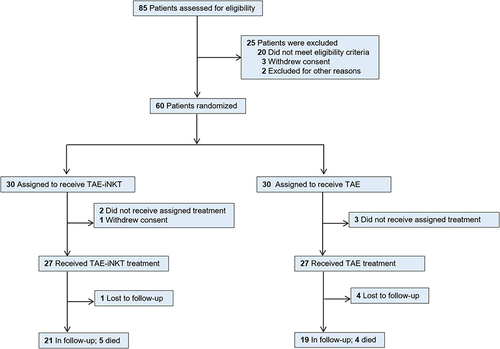
Table 1 Patient Demographic and Disease Characteristics
Figure 2 Kaplan-Meier Plot in the Modified Intention-to-Treat Population. (A) Progression-free survival since randomization. (B) Time from randomization to quality of life deterioration.
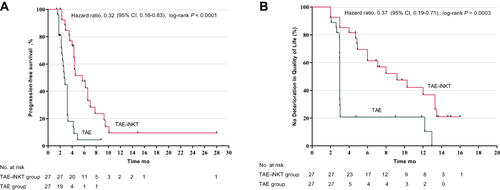
Figure 3 Duration of Response and Quantification of Lymphocytes. (A) Duration of response among responders. (B) Quantification of lymphocytes (ns, p>0.05; **p<0.01).
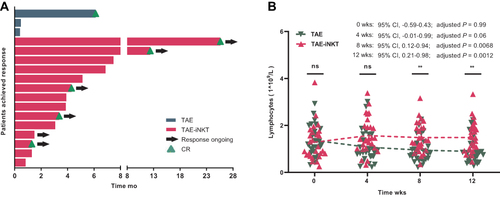
Table 2 Adverse Events