Figures & data
Figure 1 Expression signature of 18 referenced HOX-lncRNAs in HCC cells. (A) Annotation information of 18 HOX-LncRNAs from NCBI RefSeq database. (B) Relative expression levels of 15 detectable HOX-lncRNAs in five HCC cell lines (HepG2, SMMC-7721, MHCC97H, Bel-7402 and Bel-7404) and a normal liver cell line (L-O2). Data are given as mean ± SD (n = 3). *p < 0.05; ** p < 0.01; NS, not significance (p > 0.05).
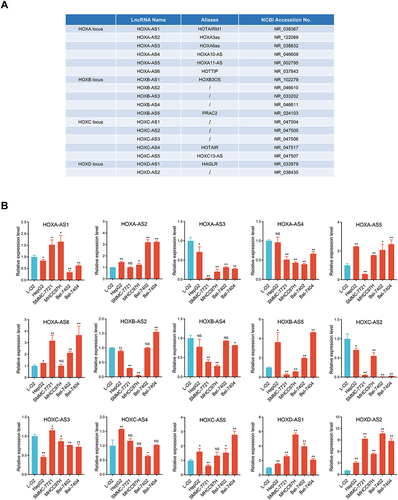
Table 1 Relationship Between HOXD-AS2 Expression and Clinicopathologic Features (Logistic Regression)
Figure 2 Bioinformatics analysis of HOXD-AS2 expression and its clinical significance in HCC. The HOXD-AS2 expression in unpaired (A) and paired (B) HCC tissues were analyzed using TCGA data. (C and D) The HOXD-AS2 expression in HCC tissues was validated in two GEO datasets. Relationship of the HOXD-AS2 expression with overall survival (E), disease-specific survival (F), and progression-free interval (G) was evaluated using TCGA data. (H) ROC curves were utilized to assess the diagnostic value of HOXD-AS2 in HCC. (I) The HOXD-AS2 expression in 30 matched paired HCC tissues and the adjacent non-tumor tissues we collected was validated by qRT-PCR. *p < 0.05, ***p < 0.001.
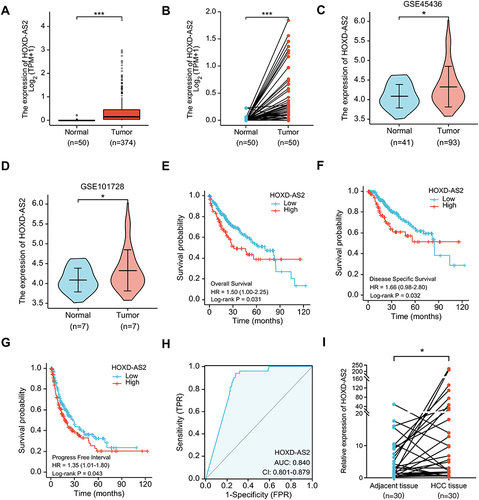
Figure 3 Subcellular localization of HOXD-AS2 in Bel-7402 cells. (A) RNA fluorescence in situ hybridization (RNA-FISH) was performed to detect subcellular location of HOXD-AS2 expression in Bel-7402 cells, U6 and 18S was positive control for nuclear and cytoplasmic localization, respectively. (B) The abundance of HOXD-AS2 in nuclear and cytoplasmic fractions of Bel-7402 cells was evaluated by qRT-PCR, MALAT1 and HULC was positive control for nuclear and cytoplasmic lncRNA, respectively. Scale bar=20 μm. Data are given as mean ± SD (n = 3). **p < 0.01.
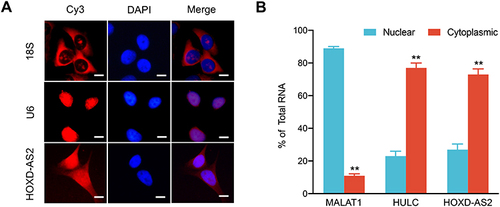
Figure 4 Knockdown of HOXD‐AS2 suppresses HCC proliferation, migration, and invasion in vitro. (A) The knockdown efficiency of HOXD-AS2 in Bel-7402 and SMMC-7721 cells was examined by qRT-PCR. The effect of HOXD-AS2 knockdown on the proliferation of HCC cells was evaluated by CCK-8 assay (B) and colony formation assays (C). The effect of HOXD-AS2 knockdown on cell cycle progression (D) and apoptosis (E) was detected by flow cytometry. The effect of HOXD-AS2 knockdown on the migration (F) and invasion (G) of HCC cells was assessed by transwell assay. siNC, negative control; siHOXD-AS2, HOXD-AS2 knockdown group. Data are given as mean ± SD (n = 3). *p < 0.05, ** p < 0.01.
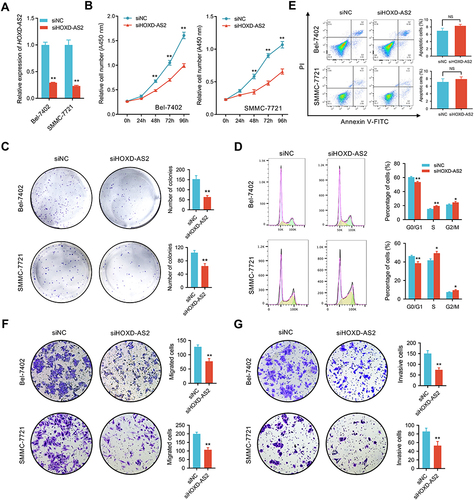
Figure 5 Knockdown of HOXD‐AS2 suppresses HCC growth in subcutaneous xenograft nude mouse model. (A) Photograph of dissected subcutaneous tumors at sacrificed time. (B) The volume of the subcutaneous tumors was measured every 7 days after implantation. (C) Tumor weight of dissected subcutaneous tumors at sacrificed time. (D) The expression of proliferative markers Ki67 and PCNA in subcutaneous tumors were detected by IHC staining, scale bar =100 μm. siNC, negative control; siHOXD-AS2, HOXD-AS2 knockdown group. Data are given as mean ± SD (n = 5). *p < 0.05.
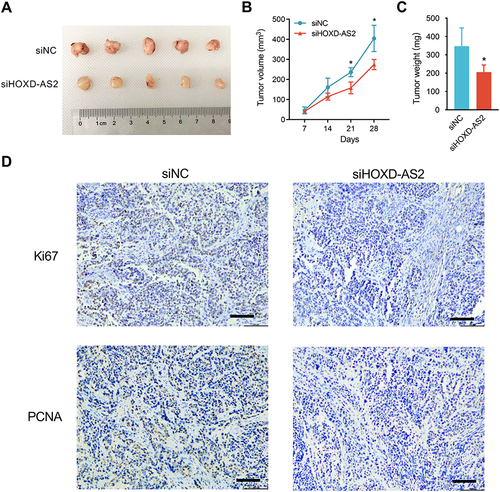
Figure 6 The effect of HOXD-AS2 knockdown on the transcriptome of HCC cells is revealed by RNA-Seq. (A) Volcano plots displaying 233 differentially expressed genes (DEGs) between knockdown and negative control Bel-7402 cells with |log2(FC)| ≥ 0.6 and FDR < 0.05. The red and blue points represent genes that up-regulated and down-regulated after HOXD-AS2 knockdown, respectively. (B) Validation of RNA-Seq results (left) through detecting nine of known HCC-related genes by qRT-PCR (right). (C) Representative GO terms for biological processes (BP) enriched by DEGs. (D) The impact of HOXD-AS2 knockdown on the expression of some critical regulators that control cell cycle and metastasis was examined by western blotting. The black triangles (▲) represent genes whose expression changed when HOXD-AS2 knockdown. (E) Representative KEGG pathway terms that enriched by DEGs. (F) The impact of HOXD-AS2 knockdown on the activity of MEK/ERK pathway was examined by western blotting. siNC, negative control; siHOXD-AS2, HOXD-AS2 knockdown group. Data are given as mean ± SD (n = 3). **p < 0.01.
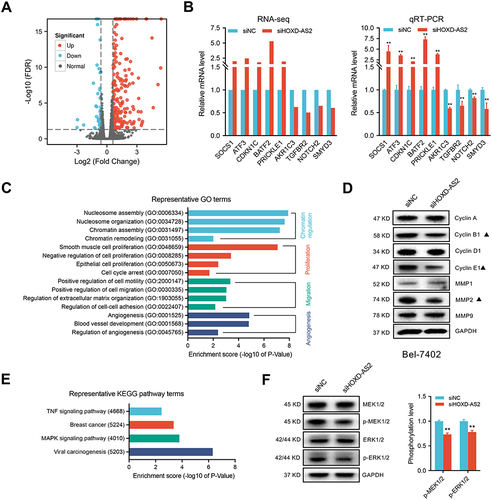
Figure 7 SMYD3-mediated the oncogenic phenotypes of HOXD-AS2 in HCC cells was confirmed by rescue experiments. (A) Correlation analysis between the expression of HOXD-AS2 and four oncogenes (AKR1C3, NOTCH2, SMYD3, TGFBR2) in HCC based on TCGA data. The regulatory effect of HOXD-AS2 on SMYD3 was validated by qRT-PCR (B) and western blotting (C). (D) The effects of HOXD-AS2 knockdown on the promoter activity of SMYD3 in HCC cells. Overexpression of SMYD3 attenuates the suppressive effects of HOXD-AS2 knockdown on HCC cell proliferation (E), migration (F and G) and invasion (H and I), scale bar =200 μm. siNC, negative control; siHOXD-AS2, HOXD-AS2 knockdown; OE-NC, empty overexpression vector; OE-SMYD3, SMYD3 overexpression; pGL3-Basic, pGL3-Basic empty vector; pGL3-SMYD3, pGL3-Basic vector containing the SMPD3 promoter. Data are given as mean ± SD (n = 3). *p < 0.05, **p < 0.01.
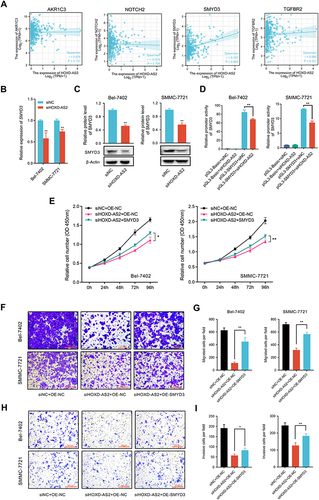
Figure 8 The protein expression changes of related molecules in rescue experiment were examined by western blotting. (A and B) Cell cycle and metastasis regulatory genes. (C and D) The activity of MEK/ERK pathway. (E and F) The overall level of H3K4me2 and H3K4me3. siNC, negative control group; siSMYD3, SMYD3 knockdown group; OE-NC, empty vector group; OE-SMYD3, SMYD3 overexpression group. Data are given as mean ± SD (n = 3). *p < 0.05, **p < 0.01, ns, not significance (p > 0.05).
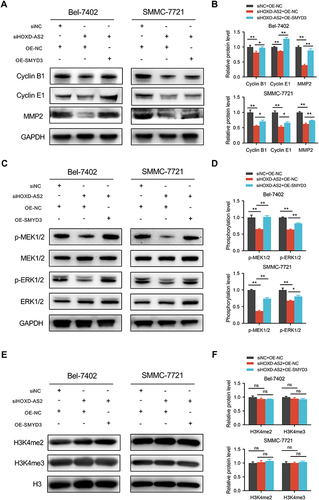
Figure 9 HOXD-AS2 can be positively regulated by its downstream gene of SMYD3 in HCC cells. The knockdown efficiency of SMYD3 in HCC cells was examined by qRT-PCR (A) and western blotting (B). The overexpression efficiency of SMYD3 in HCC cells was determined by qRT-PCR (C) and western blotting (D). The effect of knockdown (E) or overexpression (F) of SMYD3 on HOXD-AS2 expression was validated by qRT-PCR. The effect of knockdown (G) or overexpression (H) of SMYD3 on the promoter activity of HOXD-AS2 was evaluated by dual-luciferase reporter assay. (I) Schematic diagram of SMYD3 binding site in HOXD-AS2 promoter and amplification position of ChIP-qPCR primers. (J) The binding abundance of SMYD3 on the HOXD-AS2 promoter upon SMYD3 overexpression was detected by ChIP-qPCR. siNC, negative control group; siSMYD3, SMYD3 knockdown group; OE-NC, empty vector group; OE-SMYD3, SMYD3 overexpression group, pGL3-Basic, pGL3-Basic empty vector; pGL3-HOXD-AS2, pGL3-Basic vector containing the HOXD-AS2 promoter. TSS, transcription start site. Data are given as mean ± SD (n = 3). *p < 0.05, **p < 0.01.
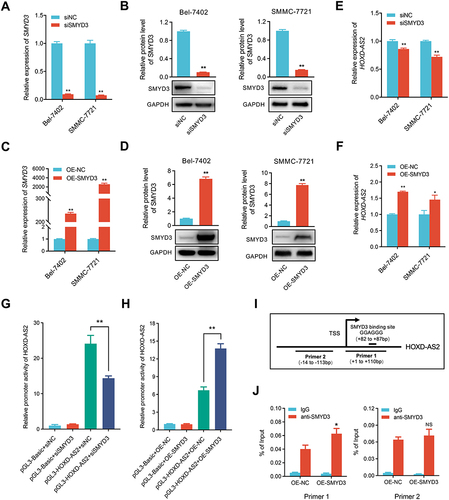
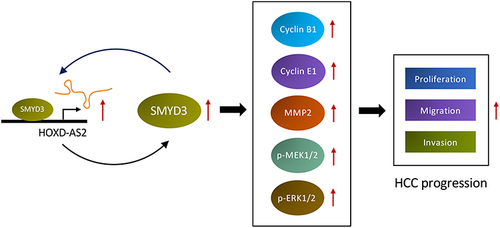
Figure 10 Schematic diagram of HOXD-AS2/SMYD3 reciprocal feedback loop facilitating HCC progression.