
Figures & data
Figure 1 DEGs were identified in normal and tumor tissues to classify HCC patients.
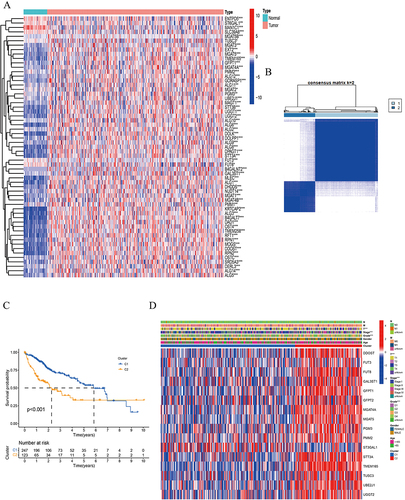
Figure 2 Construction of risk model based on N-linked glycosylation related DEGs in TCGA dataset.
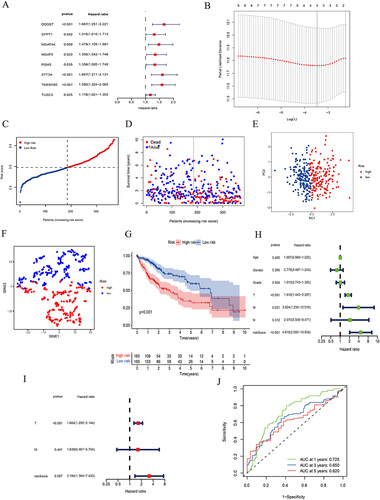
Figure 3 Validation of prognostic model.
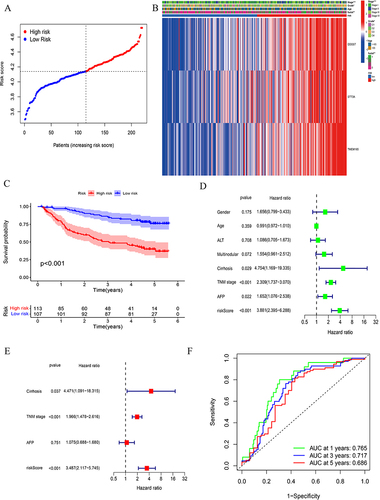
Figure 4 Correlation of the HCC subgroups with immune infiltration.
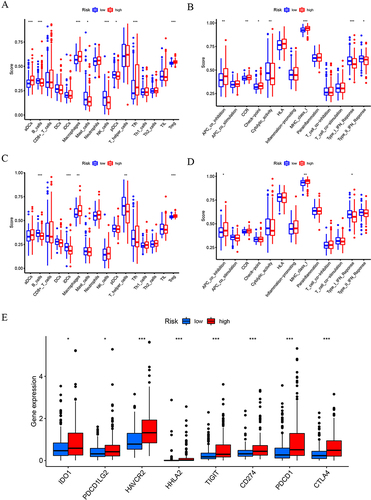
Figure 5 Prognostic models are effective in predicting responses to immunotherapy.
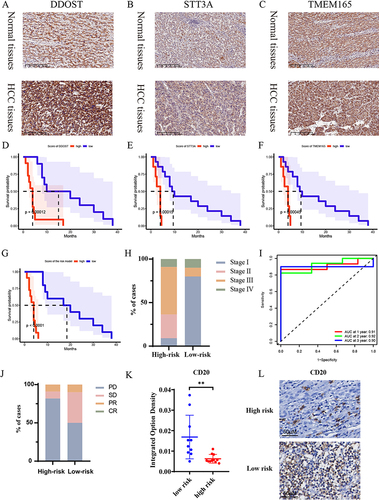
Figure 6 Knockdown of the N-linked glycosylation prognostic model related genes suppresses the proliferation of HCC cell lines.
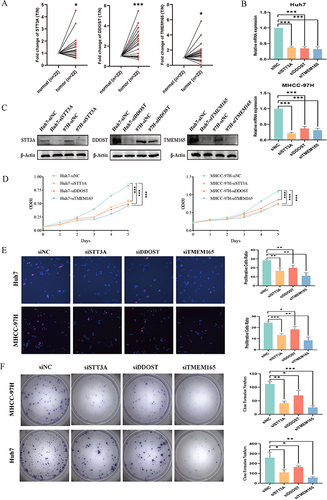
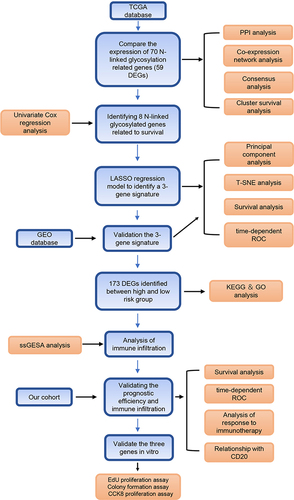
Figure 7 Flow diagram of this study.
Data Sharing Statement
Seventy N-linked glycosylation related genes were retrieved from the AmiGO2 database (http://amigo.geneontology.org/amigo).
The datasets generated and analyzed during the current study are available (https://portal.gdc.cancer.gov/) on February 12, 2022. A cohort of HCC patients with RNA-sequence and clinical features were download from GEO database on January 22, 2009, and the last follow-up update was on October 6, 2021 (https://www.ncbi.nlm.nih.gov/geo, ID: GSE14520).