
Figures & data
Table 1 Baseline Characteristics of the 334 Patients Included in the Present Study
Table 2 Baseline Characteristics After Propensity Score Matching
Figure 1 Flow diagram.
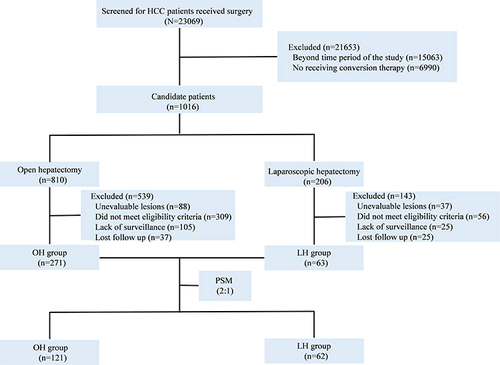
Table 3 Operative Details of Patients Who Underwent LH and OH
Table 4 Operative Details of Patients Who Underwent LH and OH After Propensity Score Matching
Figure 2 (A) Overall and (B) recurrence-free survival, according to surgical approach (open versus laparoscopic) before PSM; (C) overall and (D) recurrence-free survival, according to surgical approach (open versus laparoscopic) after PSM.
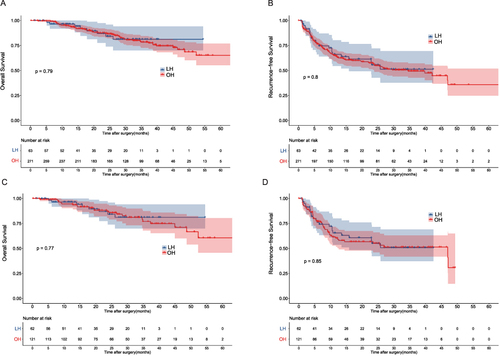
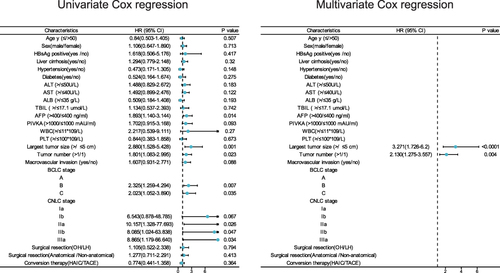
Figure 3 Univariate and multivariate Cox regression analyses of risk factors for overall survival before PSM.
Data Sharing Statement
All data generated or analyzed during this study are included in this article. Further inquiries can be directed to the corresponding author.