Figures & data
Figure 1 Typical pathological section images of Edmondson-Steiner grade. (A) Grade I. (B) Grade II. (C) Grade III. (D) Grade IV.
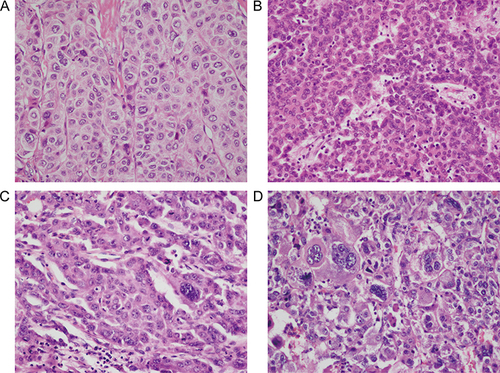
Table 1 Baseline and Clinicopathological Participant Characteristics According to the Edmondson-Steiner Grade
Table 2 Multivariate Logistic Regression Analysis of Edmondson-Steiner Grade III–IV Based on Univariate Analysis
Figure 2 Six risk factors associated with Edmondson-Steiner grade III–IV in univariate analysis (p < 0.05). (A) Alpha-fetoprotein (AFP). (B) Des-γ-carboxy prothrombin (DCP). (C) Aspartate aminotransferase to lymphocyte ratio index (ALRI). (D) Hepatitis B virus surface antigen (HBsAg). (E) Hepatitis C virus antibodies (HCVAb). (F) Macrovascular invasion. *p < 0.05, ***p < 0.001. P-values less than 0.05 or 0.001 indicate significant difference.
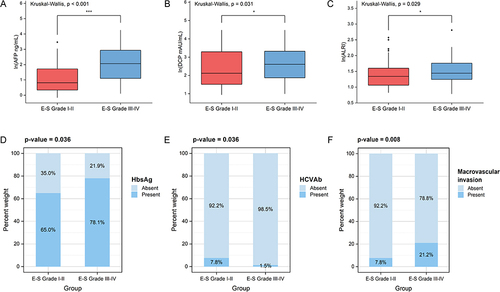
Figure 3 The development and evaluation of the nomogram model. (A) Established nomogram based on the multivariate logistic regression analysis. (B) The receiver operating characteristic (ROC) curve and area under the curve (AUC) value of the nomogram. (C) The calibration curve of the model (mean absolute error = 0.043).
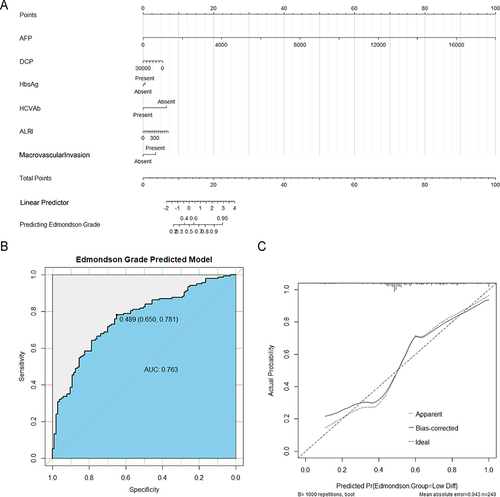
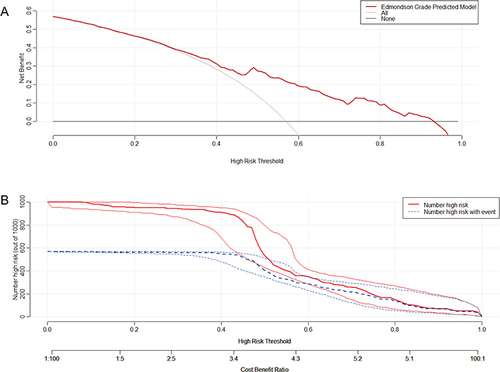
Figure 4 The decision curve analysis (DCA) (A) and clinical impact curve (B) of the nomogram model.