Figures & data
Figure 1 (A) Flowchart of the patient cohort. (B) The schema of the combination therapy.
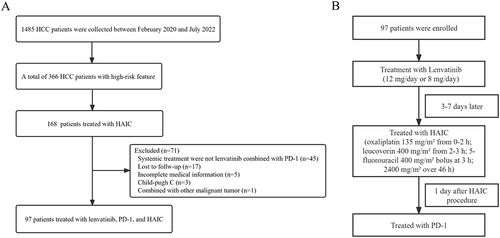
Table 1 Baseline Characteristics of 97 Patients
Table 2 Summary of Best Response
Figure 2 Kaplan–Meier curves of PFS ((A) n=97), OS ((B) n=97), DOR ((C) n=76), and intrahepatic DOR ((D) n=79).
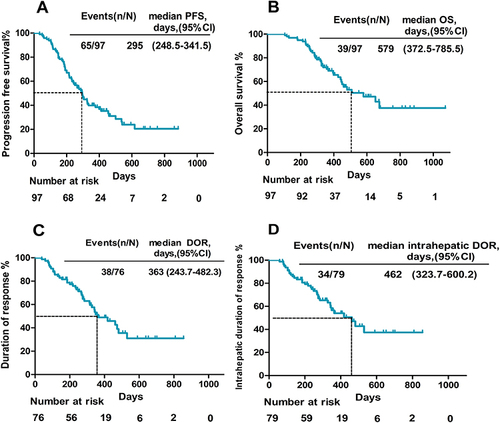
Figure 3 Kaplan-Meier plots show percent OS categorized by (A) ALBI, (B) BMI, (C) High-risk type, (D) Metastasis, (E) Child-Pugh class, and (F) PD-1 agents, with numbers at risk shown below the graph.
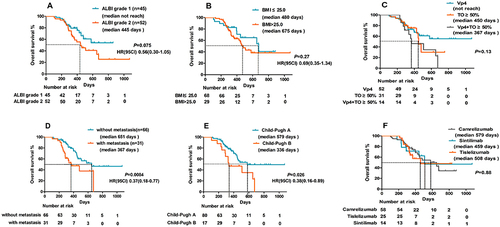
Figure 4 Percentage changes from baseline. (A) Best percentage change from baseline in intrahepatic target lesion per RECIST 1.1. The dashed line at 30% change represents the partial response. (B) Best percentage change from baseline in intrahepatic target lesion per mRECIST. The dashed line at 30% change represents the partial response.
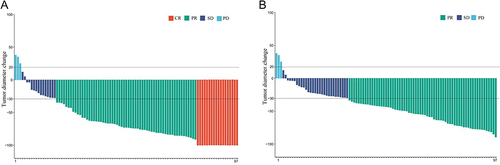
Table 3 Univariable and Multivariable Analyses of Covariates Associated with PFS
Table 4 Univariable and Multivariable Analyses of Covariables Associated with OS
Table 5 Treatment-Related Adverse Events
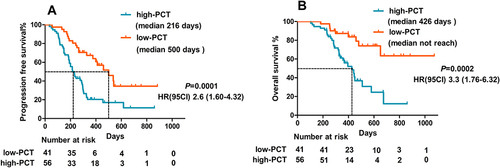
Figure 5 The levels of PCT before the treatment might be a predictive biomarker for the efficacy of combination therapy. Kaplan–Meier curves of PFS (A) and OS (B) between high- and low-PCT groups.