
Figures & data
Figure 1 Downregulated ACAA2 was associated with HCC progression. (A) Gene expression of ACAA2 in different tumor types; blue: normal tissues; red: tumor tissues; (B) Gene expression of ACAA2 in different disease stages, data derived from GSE6764; (C–F) Compared gene expression of ACAA2 between different groups, data derived from TCGA-LIHC dataset; (G) GSEA data revealed the correlation between gene expression of ACAA2 and cell cycle; (H) The correlation between the expression of ACAA2 and MATH score; (I) The correlation between the expression of ACAA2 and stemness. **p<0.01; ***p<0.001; ****p<0.0001.
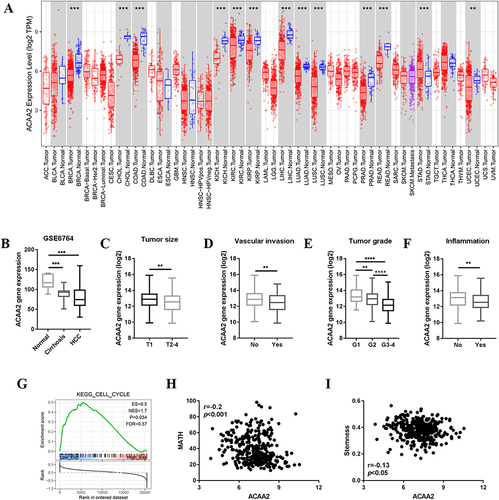
Figure 2 ACAA2 served as a biomarker for immunotherapy. (A) The correlation between ACAA2 and immune cell types and MHC; (B) Correlation between ACAA2 and immune check points; (C) Correlation between ACAA2 and TIDE score; (D) Compared the expression of ACAA2 between different groups; (E) Kaplan-Meier curves were used to determine the overall survival between different groups; (F) Kaplan-Meier curves were used to determine the disease-free survival between different groups; (G) Kaplan-Meier curves were used to determine the prognostic value of risk score; (H) Kaplan-Meier curves were used to determine the combine effect of ACAA2 and risk score on the prognosis of HCC; *p<0.05; **p<0.01; ****p<0.0001.
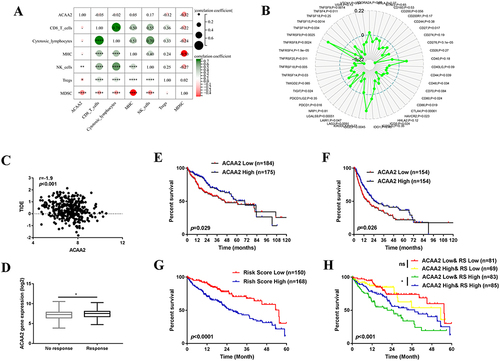
Figure 3 Downregulated ACAA2 promoted proliferation and metastasis of HCC. (A) Gene expression of ACAA2 in different cell lines; (B and C) Gene expression of ACAA2 in the indicated cell lines; (D) The protein expression of ACAA2 was examined by Western blot in the indicated cell lines; (E and G) CCK8 assays was used to determine the proliferation of the indicated cell lines and the value of OD450 was related to control; (F and H) Representative images for cell cycle assays in indicated cell lines in the left panel, and statistical analysis in the right panel. (I and J) The migration and invasion abilities of the indicated cell lines were detected by Transwell assays in the left panel, and the statistical analysis was placed in the right panel. Bar=50µm (K) Representative images of subcutaneous tumors derived from indicated cell lines in left panel; the statistical analysis of bioluminescence signal in the right panel; (L) Representative images of liver xenograft derived from indicated cell lines in left panel; the statistical analysis of bioluminescence signal in the right panel. Five mice were used for each group *p<0.05; **p<0.01; ***p<0.001; ****p<0.0001.
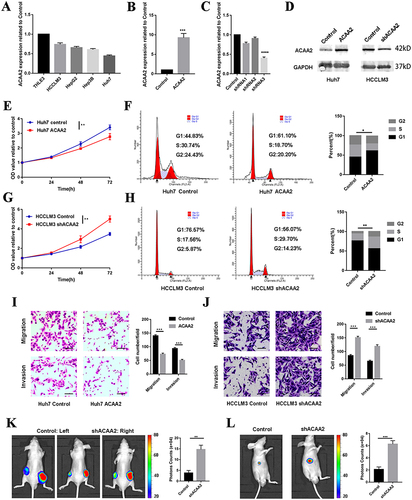
Figure 4 Downregulated ACAA2 facilitated HCC progression via the NF-κB signaling pathway. (A) Volcano plot exhibited the gene expression altered after ACAA2 knockdown; (B) Different expression genes were enriched in KEGG pathways; (C) Different expression genes were enriched in Hallmark pathways; (D–F) Different expression genes were enriched in GO pathway; (G and H) The protein expression of pNKFB and NFKB were examined by Western blot in the indicated cell lines. 7.5µM BAY11-7082 was used to inhibit the NFKB signaling pathway; (I) CCK8 assays was used to determine the proliferation of the indicated cell lines and the value of OD450 was related to control; **p<0.01; ***p<0.001.
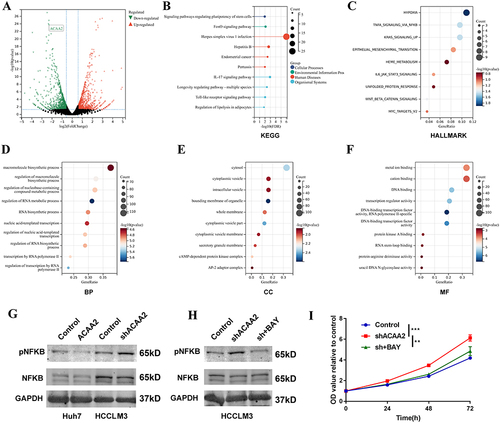
Figure 5 CXCL1 contributed to the low level of ACAA2 related immune suppression microenvironment. (A) Gene expression of CXCL1 in the indicated cell lines in the upper panel; protein expression of CXCL1 in the indicated cell lines in the lower panel; (B) The top 10 common signaling pathways that both ACAA2 and CXCL1 were involved in; (C) The cell types were identified; single-cell RNA (scRNA) data was derived from GSE125449; (D) The expression of ACAA2 and CXCL1 in different cell types; (E) The correlation between ACAA2 and immune cell types and immune check points; (F) Compared the expression of ACAA2 in different groups; (G) Linear regression analysis was used to determine the relationship between ACAA2 and CXCL1 in HCC; data was derived from TCGA-LIHC. **p<0.01; ***p<0.001; ****p<0.0001.
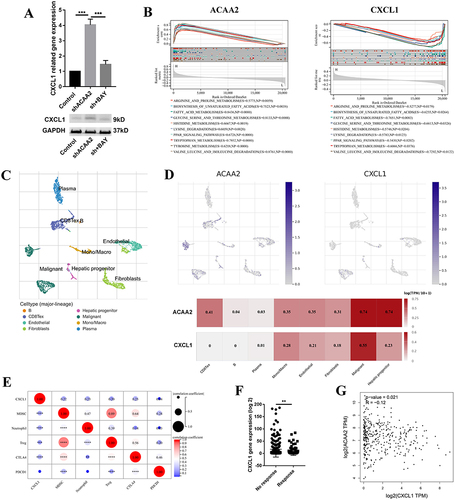
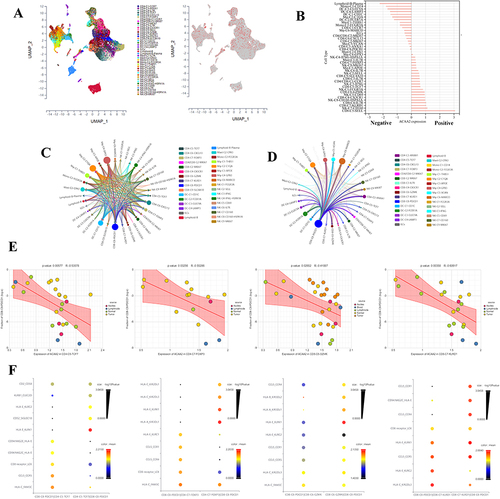
Figure 6 Exploring the role of ACAA2 in the immune cells. (A) The cell types were identified; single-cell RNA (scRNA) data was derived from GSE140228; (B) The expression of ACAA2 in different cell types; (C) Ligand-receptor networks among the cell types; (D) Ligand-receptor networks between CD8-C8-PDCD1 cell type and other cell types; (E) The correlation between the expression of ACAA2 in the four cell types and composition of CD8-CD-PDCD1 cell type in HCC; (F) The top 10 ligand-receptor networks for cell types.
Data Sharing Statement
The datasets presented in this study can be found in online datasets. The names of the datasets can be found in the article material. The datasets used and analyzed during the current study are available from the corresponding author on reasonable request.