Figures & data
Figure 1 The red shaded part in the CT image represents the area of skeletal muscle. L3 SMI= 28.89 cm²/m². L3 SMI= 66.48 cm²/m².
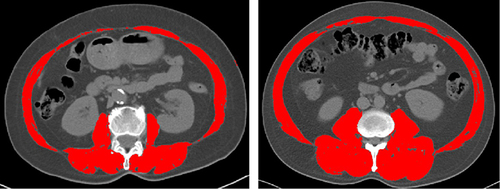
Table 1 Baseline Characteristics of Patients of the Whole Study Population
Figure 2 RFS (A) and OS (B) after hepatectomy in MAFLD-HCC patients with or without sarcopenia before PSM.
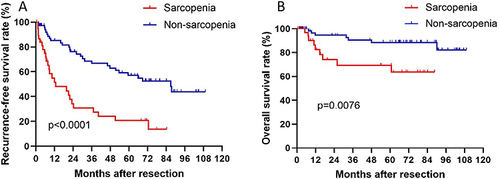
Table 2 Univariate and Multivariate Analyses of Each Factor’s Value in Predicting RFS and OS of the Whole Study Population
Table 3 Baseline Characteristics of Patients in the Propensity Score Matching Cohort
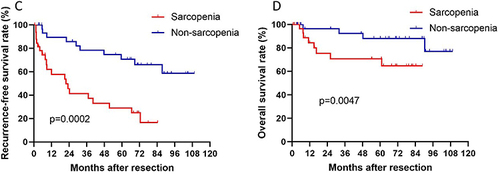
Figure 3 RFS (C) and OS (D) after hepatectomy in MAFLD-HCC patients with or without sarcopenia after PSM.