Figures & data
Table 1 Patient Characteristics in Primary and Validation Cohort
Figure 1 Flowchart of data sampling.
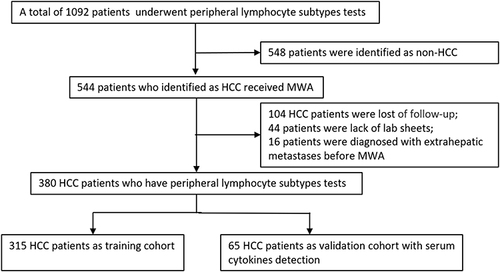
Table 2 Univariate and Multivariate Analyses of Prognostic Factors Associated with EHM
Figure 2 Kaplan-Meier analyses for MFS according to CD4+ cell ratio (A), CD8+ cell ratio (B), and combined (CD4+/CD8+) cell ratio (C) in the primary cohort.
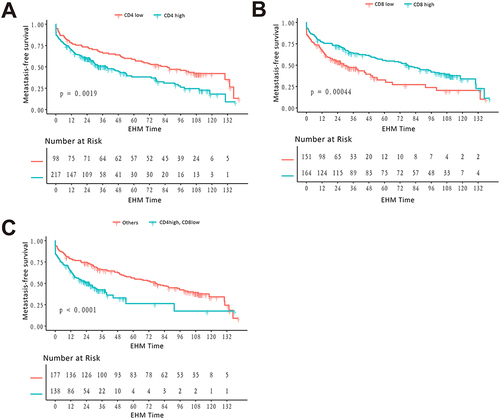
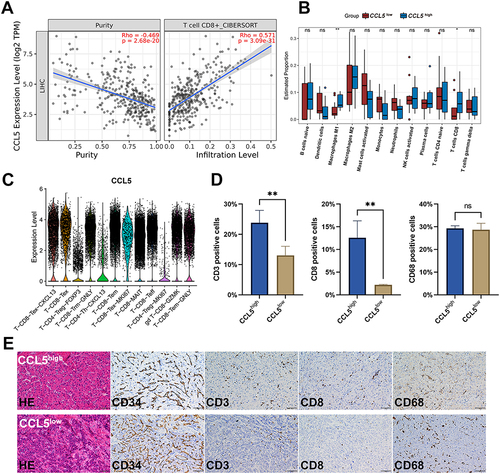
Figure 3 CCL5 modulated the intratumoral infiltration level of CD8+ T cells. (A) The association between CCL5 expression and immune infiltration levels of multiple CD8+ T cell types estimated using the TCGA database. (B) Evaluation of immune cell infiltration in the TME of HCC patients according to CCL5 gene expression using CIBERSORT. *P < 0.05, **P < 0.001. (C) Violin plot showing the CCL5 expression levels in the 12 lymphocyte subtypes in tumors of HCC patients. (D) Quantitative analysis of the ratio of CD3, CD8, and CD68 positive cells in the tumor region. **P < 0.001. (E) Immunohistochemistry done to detect the expression pattern of CD34, CD3, CD8, and CD68 positive cells in HCC patients with different serum CCL5 levels (n = 3). Scale bar: 100μm.