
Figures & data
Table 1 Patient Characteristics of CP-A/B (Score of 7–9) Patients with TACE Therapy Before Propensity Score Matching
Table 2 Patient Characteristics of CP-A/B (Score of 7–9) Patients with TACE Therapy After Propensity Score Matching
Table 3 Baseline Characteristics of CP-A/B (Score of 7) Patients with TACE Therapy Before and After Propensity Score Matching (PSM)
Figure 1 Flow chart of patient selection.
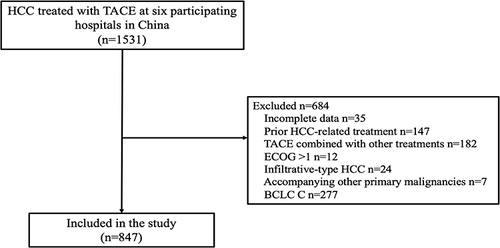
Figure 2 Kaplan–Meier survival curves stratified by the Child-Pugh class [Child-Pugh (A) vs Child-Pugh (B) (score of 7–9)] after propensity score matching.
![Figure 2 Kaplan–Meier survival curves stratified by the Child-Pugh class [Child-Pugh (A) vs Child-Pugh (B) (score of 7–9)] after propensity score matching.](/cms/asset/8125fcc3-b36f-4882-a53b-7e67a995ee92/djhc_a_12295834_f0002_c.jpg)
Figure 3 Kaplan–Meier survival curves stratified by the Child-Pugh class [Child-Pugh (A) vs Child-Pugh (B) (score of 8–9)] after propensity score matching.
![Figure 3 Kaplan–Meier survival curves stratified by the Child-Pugh class [Child-Pugh (A) vs Child-Pugh (B) (score of 8–9)] after propensity score matching.](/cms/asset/43e078e3-7ea8-42cc-9fde-10af995b91a3/djhc_a_12295834_f0003_c.jpg)
Figure 4 Kaplan–Meier survival curves stratified by the Child-Pugh class [Child-Pugh (A) vs Child-Pugh (B) (score of 7)] after propensity score matching.
![Figure 4 Kaplan–Meier survival curves stratified by the Child-Pugh class [Child-Pugh (A) vs Child-Pugh (B) (score of 7)] after propensity score matching.](/cms/asset/12c1b288-2b6c-4c92-95d9-9802b50820c1/djhc_a_12295834_f0004_c.jpg)