Figures & data
Table 1 Baseline Characteristics of Study Patients
Figure 1 Flowchart of patient selection.
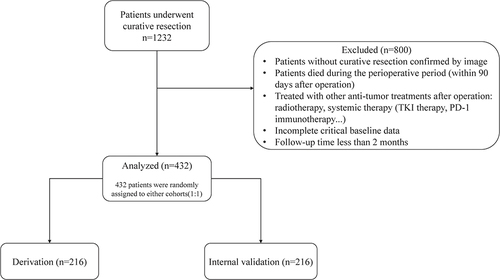
Figure 2 The difference in OS between the training and validation sets examined by Kaplan-Meier survival curves (A). Kaplan–Meier survival curves for PA-TACE’s impact on OS of the patients (B).
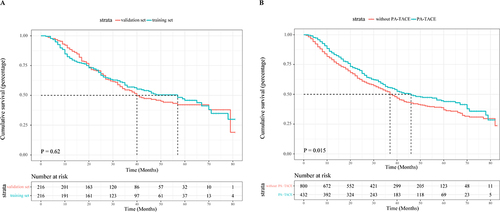
Figure 3 The value of the correlation coefficient between variables is displayed in the form of a heat map, and the value is mainly expressed by color depth.
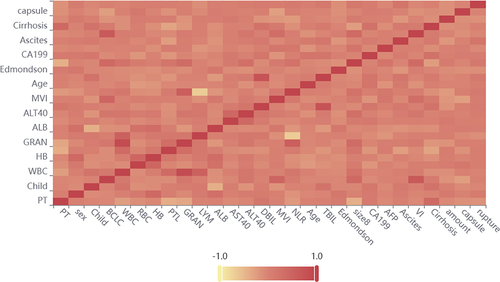
Figure 4 28 prognostic factors’ expression patterns (A). The LASSO model’s 10-fold cross-validation for selecting variables (B).
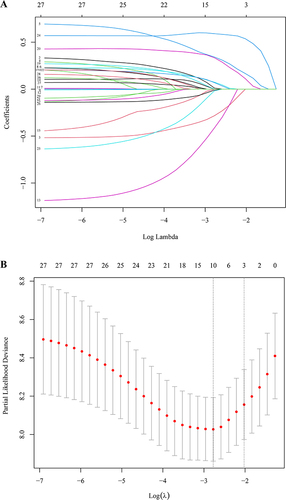
Table 2 Uni- and Multivariate Analysis for Overall Survival in the Derivation Cohort
Figure 5 Nomogram for predicting OS in HBV-HCC (hepatitis B virus-associated hepatocellular carcinoma) patients with PA-TACE.
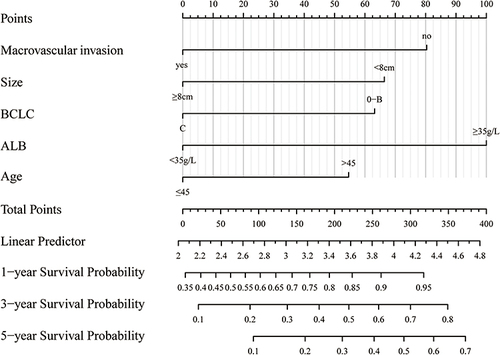
Figure 6 The training set (A) and validation set’s (B) Kaplan-Meier survival curves for predicting OS stratified by risk subgroups. Kaplan–Meier survival curves for PA-TACE’s impact on OS of the patients from high-risk group (C) and low-risk group (D).
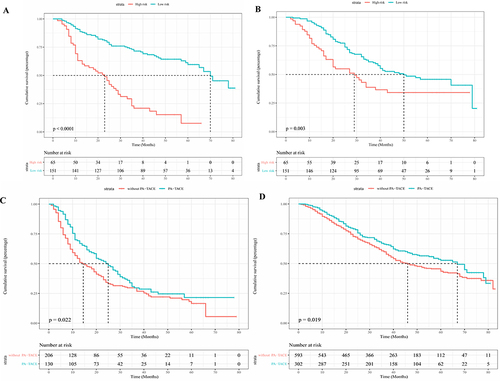
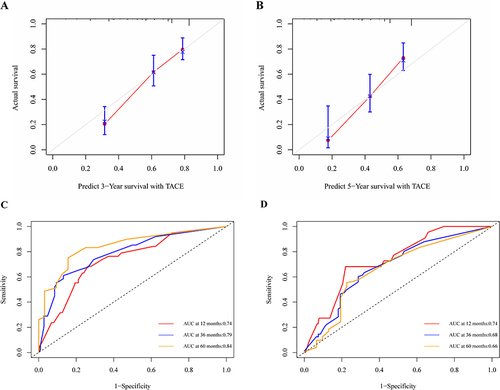
Figure 7 Calibration curves for predicting patients’ survival outcomes at 3 years (A) and 5 years (B) in the training set. Receiving operating characteristics (ROC) curves of the model to predict 1-, 3-, and 5-year OS in the training set (C) and validation set (D).