Figures & data
Figure 1 Overview of the experimental workflow of fluorescent-nanoparticle tracking analysis (F-NTA) to quantify HCC exosomes in their native state. (A). Shows antibody selection to immunocapture HCC exosomes. PE-labeled AFP and GPC3 antibodies are specific to HCC-derived exosomes used alone or in combination. (B). Brief presentation of clinical assay used to capture highly purified HCC exosomes for F-NTA quantification. 10μL of human serum was diluted in 100μL of PBS with 1% BSA. Antibody incubation was performed overnight at 4°C with shaking. The next day, the sample was diluted in 1mL of ultrapure-filtered distilled water and passed through the Sephadex column. Samples were further diluted 1:10 in ultrapure water and analyzed by NTA in light scattered mode (LSM) and fluorescence mode (FM).
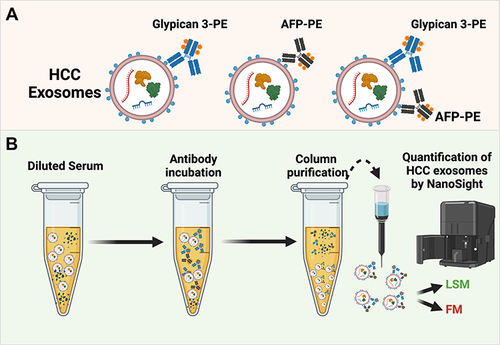
Figure 2 Optimization of fluorescent-nanoparticle tracking analysis (F-NTA) measurement using synthetic fluorescent and non-fluorescent beads. (A). Shows video images of unlabeled and labeled fluorescent synthetic beads in suspension examined using NTA in light scattered mode (LSM) and fluorescence mode (FM). Only fluorescence-labeled synthetic beads were detected in both LSM and FM (B). Show the sensitivity and specificity of F-NTA analysis using synthetic beads. A snapshot of video images of particles in motion using NTA analysis of synthetic beads in LSM and FM. A fixed amount of unlabeled synthetic beads were spiked with different concentrations of fluorescence-labeled synthetic beads. (C). Shows particle size distribution of synthetic beads analyzed by NTA. (D). Show quantification of synthetic fluorescence beads by NTA. The detection range of F-NTA is shown.
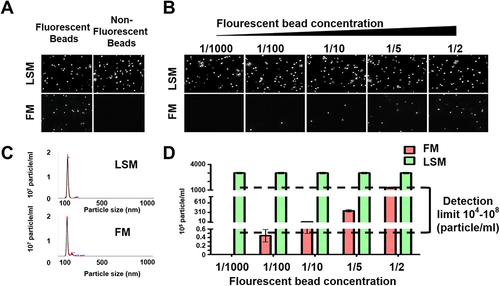
Figure 3 Recovery and quality assessment of immunocapture-HCC exosomes purified by size exclusion column purification for nanoparticle tracking analysis (NTA). Immunocaptured HCC exosomes were diluted in 1mL of ultrapure water and passed through a gel filtration column to separate free labeled antibodies. (A). Size and concentration measurement of extracellular vesicles (EVs) isolated by various columns by NTA. (B). Video images of EVs in motion captured via light scatter model. (C) Particle recovery by various columns. (D) Size of particle isolated by various columns.
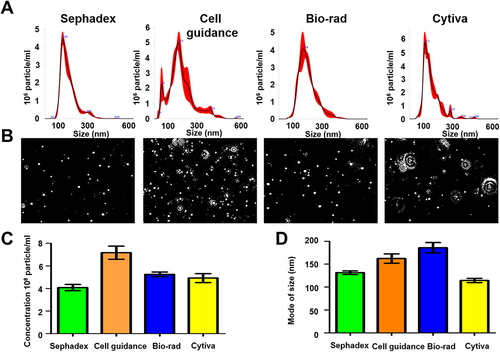
Figure 4 Purification of extracellular vesicles (EVs) by size exclusion chromatography preserves immunoreactivity assessed by fluorescent-nanoparticle tracking analysis (F-NTA). (A). Shows effectiveness of purification after using lipophilic membrane dye (Cell Mask Plasma Membrane Stain) for staining EV’s. According to percentages of the positive stained vesicles, most of the EV’s are membranous. (B). A pie chart shows the EV population diversity of exosome and microvesicle after immunocaptured using PE-labeled CD9 antibody and PE-labeled ARF6 antibody from cell culture, and clinical samples (normal serum, cirrhosis with or without HCC). As predicted, the F-NTA analysis shows exosome release increased in chronic liver disease as compared to only among healthy individuals. A large percentage of EVs remain unlabeled. (C). Show clinical application of F-NTA to quantify liver-derived EVs using PE-labeled antibodies to ASGPR1. The percentage of liver-derived vesicles was lower in cirrhosis and HCC groups than the healthy controls.
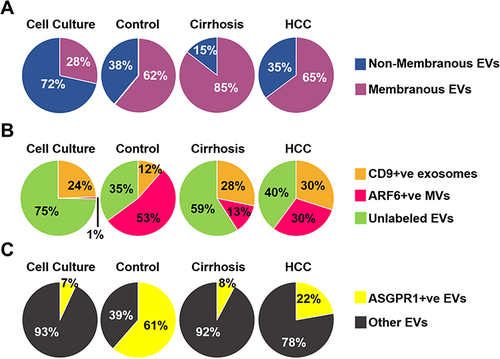
Figure 5 Assay calibration using exosome purified from Huh7 culture. Approximately 1×10⁷ Huh 7 cells were cultured in a 10-cm tissue culture plate. Media were collected after 72 hours and exosomes were precipitated from 1-mL cell-free supernatants by precipitation. Exosomes were recovered after centrifugation. The exosome pellet was resuspended in 100μL of PBS with 1%BSA and incubated with PE-labeled GPC3, AFP, and CD9 overnight. The next day, samples were diluted in 1 mL water and passed through a column. Extracellular vesicles (EVs) collected from flow-through were diluted in water (1:10) and immediately analyzed by fluorescent-nanoparticle tracking analysis (F-NTA) using light scattered mode (LSM) and fluorescence mode (FM). (A). Video images of PE-conjugated CD9 antibody labeled EVs were captured from Huh7 and HuCCA-1 culture and measured by F-NTA in LSM and FM. (B). Representative video image of PE-labeled GPC3 antibody-labeled HCC exosomes captured from HuCCA-1 and Huh7 cells and measured by NTA in LSM and FM. (C). Total exosomes and HCC exosomes are released per tumor cell. The total exosome release from HuCCA-1 cells is more than from Huh7 cells. HuCCA-1 cells release a minimum number of HCC exosomes as compared to Huh7 cells. Statistical significance levels were presented as ns for non-significant, * for p<0.05, ** for p<0.01.
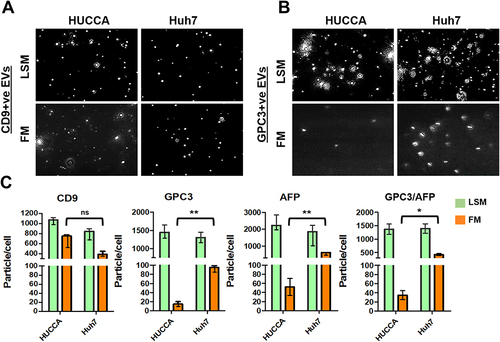
Figure 6 Quantification of GPC3+ve HCC exosomes using fluorescent-nanoparticle tracking analysis (F-NTA). Ten microliters of serum samples were diluted in 100 μL of PBS with 1% BSA. Antibody incubation was performed at 4 °C overnight. The next day samples were diluted in 1mL of ultrapure water and passed through a gel-filtration column. Samples were further diluted (1:10) in 1mL water and analyzed by NTA using light scattered mode (LSM) and fluorescence mode (FM). (A). Representative video image of Extracellular vesicles (EVs) analysis captured in LSM and FM of immunocaptured using PE-conjugated GPC3 antibody. (B). Show the size (mean and mode) measured in LSM and FM. (C) Concentration measurement of immunocaptured EVs (particles/mL) using GPC3 antibody levels in normal, cirrhosis, and HCC serum detected using FM. The particle number obtained in FM was normalized with the particle number obtained in LSM for each sample. *** is representing the statistical significance level of p<0.001. (D). ROC analysis shows the sensitivity and specificity values of GPC3 vesicles in normal, cirrhosis, and HCC.
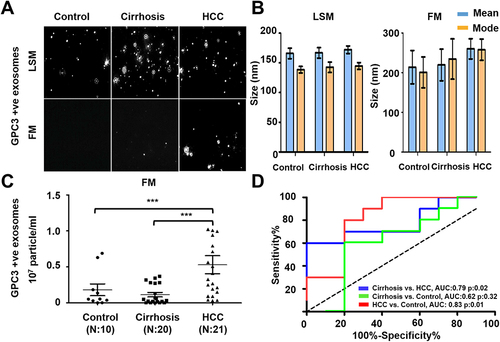
Figure 7 Quantification of AFP+ve HCC exosomes using fluorescent-nanoparticle tracking analysis (F-NTA). Ten microliters of serum samples were diluted in 100μL of PBS with 1% BSA. AFP antibody (1:100) incubation was performed at 4°C overnight. The next day samples were diluted in 1mL of ultrapure water and passed through a gel-filtration column. Samples were further diluted (1:10) in 1 mL water and analyzed by NTA. (A). Representative video image of extracellular vesicles (EVs) analysis captured in light scattered mode (LSM) and fluorescence mode (FM) of immunocaptured using PE-conjugated AFP antibody. (B). Show the size (mean and mode) measured in LSM and FM. (C). Particle size distribution of EVs analyzed in LSM and FM. Quantification of immunocaptured EVs using AFP antibody in normal, cirrhosis and HCC serum detected using FM. The particle number obtained in FM mode was normalized with the particle number obtained in LSM for each sample. Statistical significance levels were presented as ns for non-significant, * for p<0.05 (D). ROC analysis shows the sensitivity and specificity values of AFP vesicles in normal, cirrhosis, and HCC.
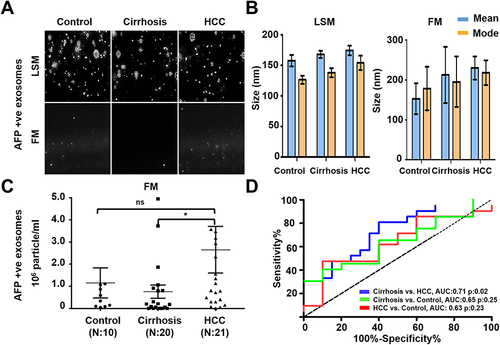
Figure 8 Quantification of AFP and GPC3 double-positive HCC exosome using the combination of two antibodies (AFP and GPC3). (A). Representative video image captured during extracellular vesicles (EVs) analysis in light scattered mode (LSM) and fluorescence mode (FM) of immunocaptured using PE-conjugated AFP and GPC3 antibody combination. (B). Show the size (mean and mode) of immunocaptured EVs using two antibodies measured in LSM and FM. (C) Quantification of immunocaptured EVs using a combination of two antibodies (GPC3/AFP) in normal, cirrhosis and HCC serum detected using FM. The particle number obtained in FM was normalized with the particle number obtained in LSM for each sample. Statistical significance levels were presented as non-significant, * for p<0.05 (D). ROC analysis shows the sensitivity and specificity values of HCC exosome quantification using the combination of AFP and GPC3 antibodies in normal, cirrhosis, and HCC.
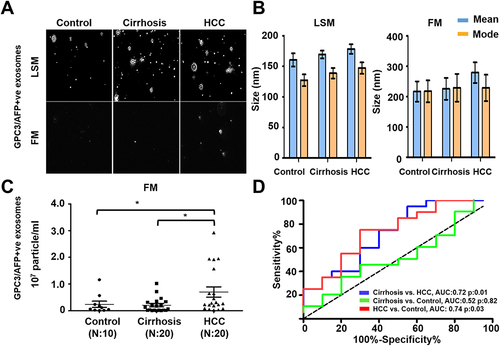
Figure 9 Performance of magnetic bead assay for HCC detection using antibodies to GPC3 alone, AFP alone, and a combination. (A). Illustrate the assay design. Streptavidin-conjugated magnetic beads were attached to a biotinylated CD63 antibody. The next day, beads were incubated with 10μL of the serum diluted in 100μL PBS with 1%BSA overnight. The next day, beads were washed twice and then incubated with PE-conjugated antibodies (GPC3 alone, AFP alone, and combination) for one hour. Following this step, beads were washed and analyzed by a flow cytometer. (B). Percentage of exosomes reacted with GPC3 antibody by magnetic bead-based flow assay in normal healthy serum, cirrhosis, and cirrhosis with HCC. (C). Percentage of HCC exosome captured using AFP antibody using magnetic bead-based flow assay between normal healthy serum, cirrhosis, and cirrhosis with HCC. (D). Percentage of HCC exosome captured using a combination of AFP and GPC3 antibodies in normal healthy serum, cirrhosis, and cirrhosis with HCC. Statistical significance levels were presented as ns for non-significant, ** for p<0.01, *** for p<0.001 (E). Representative flow cytometry image showing very high reactivity of HCC exosomes using the combination of two antibodies. (F). ROC analysis shows the sensitivity and specificity of immunomagnetic bead flow assay for HCC exosome quantification.
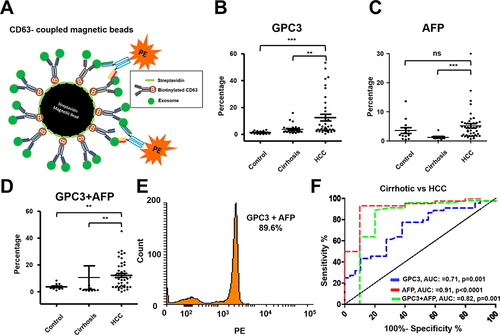
Table 1 Comparison of MRI Negative and Positive Groups for Demographics, F-NTA, and Serum AFP Results
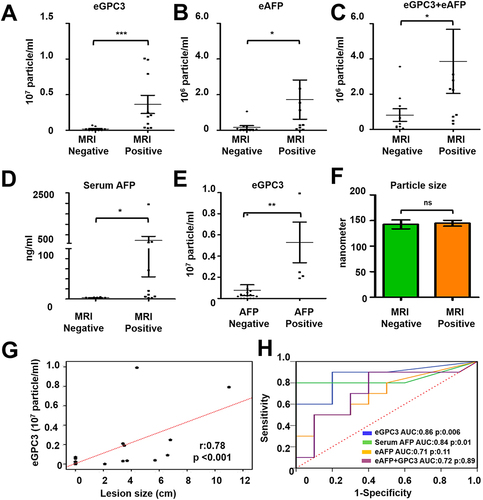
Figure 10 Statistical analysis determines the performance of HCC exosome quantification by fluorescent-nanoparticle tracking analysis (F-NTA) among MRI positive and negative serum samples of our patient cohort. The fluorescence-positive exosome number is normalized with the total number of extracellular vesicles (EVs) captured by light scatter mode in each sample. (A). Quantification of GPC3+ve exosomes in serums obtained from MRI positive and negative cases. (B). Quantification of HCC exosome using PE-labeled AFP antibodies in the same set of serum samples. (C). Quantification of HCC exosomes using a combination of PE-labeled GPC3 and PE-labeled AFP antibodies. (D). Comparison of MRI-positive and MRI-negative cirrhosis samples for serum AFP levels. (E). Comparison for GPC3+ve HCC-exosome concentration in AFP negative and AFP positive groups. The upper limit of AFP was considered as 20 ng/mL (F). Statistical significance levels were presented as ns for non-significant, * for p<0.05, ** for p<0.01, *** for p<0.001. The exosome size is comparable between the MRI-positive and negative groups. (G). Show correlation between HCC-exosome quantification with HCC size determined by MRI in the HCC cohort. (H). ROC analysis shows the sensitivity and specificity values of marker-positive exosome quantification and serum AFP levels for diagnosing HCC in liver cirrhosis.