Figures & data
Figure 1 The study flowchart and the radiomics workflow. (A) Inclusion and exclusion flowchart of patients; (B) radiomics workflow.
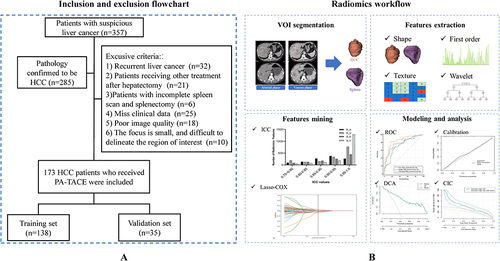
Table 1 Basic Characteristics of Enrolled Patients
Table 2 Preoperative Predictors for ER in the Training and the Validation Sets
Figure 2 The weights of the features contained in HCC (A) and spleen (B). The classification and interpretation for radiomics features were listed in Table S2.
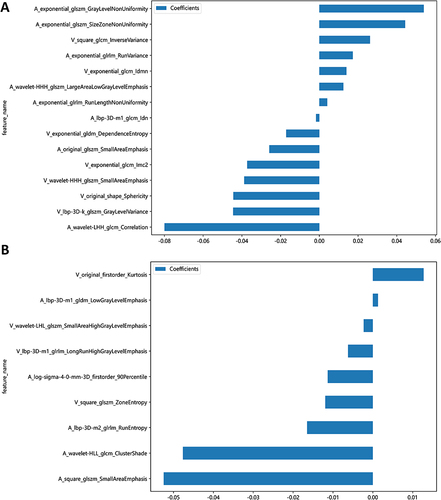
Table 3 Predictive Performances of Three Radiomics Scores for Predicting ER Probability
Figure 3 ROC curves of three prediction models to predict ER in PA-TACE patients. (A) Training set; (B) validation set.
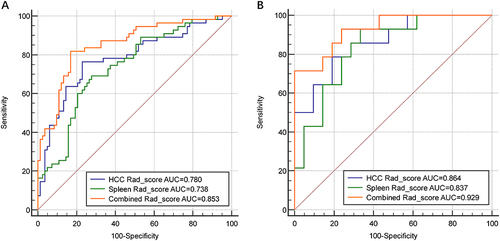
Figure 4 Two presented cases of PA-TACE patients who had distinctly different relapse situations with similar clinicopathological features showed significantly different combined Rad_score (0.96 vs 0.13, p<0.001). In the left CT scan image, the region delineated by the Orange contour represents the area of the liver tumor, while the region delineated by the purple contour represents the area of the spleen. Both contours were manually drawn.
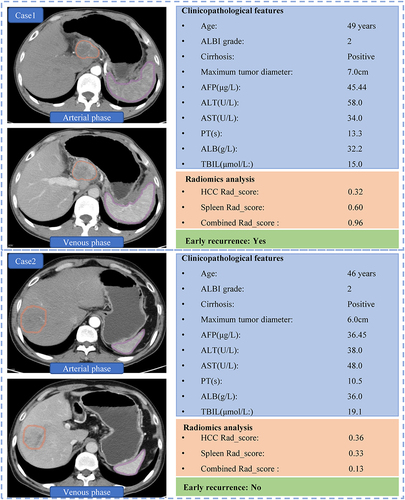
Table 4 Statistical Analysis of Meaningful Preoperative Predictors for ER
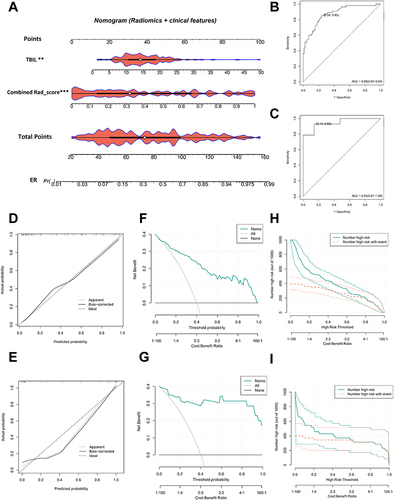
Figure 5 Radiomics nomogram for ER prediction and its assessment. Radiomics nomogram combining the TBIL level and combined Rad_score (A) ROC curves of radiomics nomogram in training (B) and validation (C) sets. Calibration curve of radiomics nomogram in training (D) and validation (E) sets. Decision curve analysis of radiomics nomogram in training (F) and validation (G) sets. Clinical impact curve of radiomics nomogram in training (H) and validation (I) sets.