
Figures & data
Table 1 Baseline Characteristics of the Patients
Figure 1 Flow diagram showed selection criteria.
Abbreviations: uHCC, unresectable hepatocellular carcinoma; TACE-L-P, transarterial chemoembolization combined with lenvatinib and PD-(L)1 inhibitor; TACE-L, transarterial chemoembolization combined with lenvatinib.
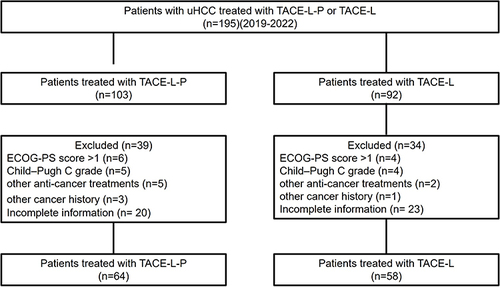
Table 2 Tumor Response
Table 3 Tumor Response of Different PD-(L)1 Inhibitor Groups
Figure 2 Kaplan–Meier curves of progression-free survival.
Abbreviations: TACE-L-P, transarterial chemoembolization combined with lenvatinib and PD-(L)1inhibitor; TACE-L, transarterial chemoembolization combined with lenvatinib; HR, hazard ratio; CI, confidence interval.
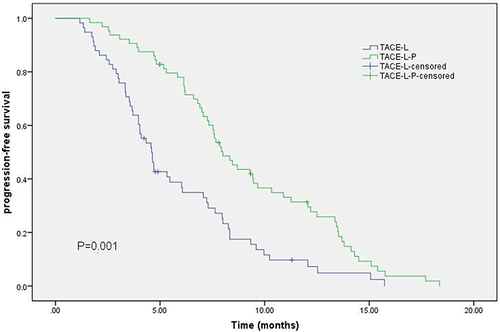
Table 4 Univariate and Multivariate Analyses of Risk Factors for FPS
Table 5 Treatment-Related Adverse Events in Two Groups