Figures & data
Figure 1 The flow of study.
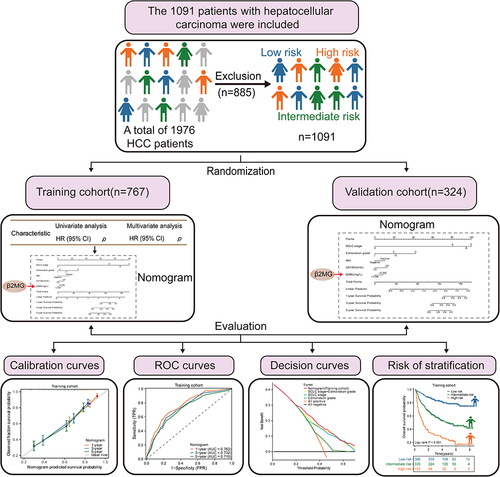
Table 1 Patient Demographics and Clinical Characteristics
Figure 2 Kaplan-Meier curve of microglobulin. (A) Kaplan-Meier curve of α1MG in the training cohort. (B) Kaplan-Meier curve of β2MG in the training cohort. (C) Kaplan-Meier curve of α1MG in the validation cohort. (D) Kaplan-Meier curve of β2MG in the validation cohort.
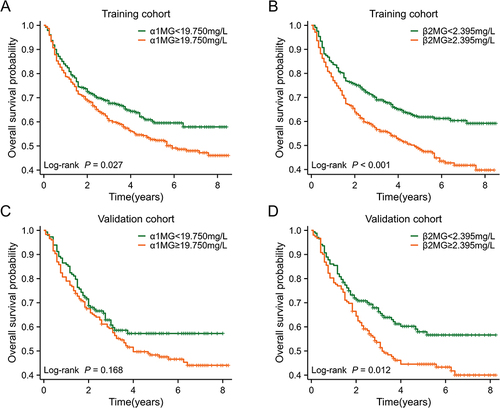
Table 2 Univariate and Multivariable Analysis for Overall Survival of the Training Cohort
Figure 3 Nomograms for the prediction of 1-, 3- and 5-year OS. (A) The nomogram of the training cohort; (B) The nomogram of the validation cohort.
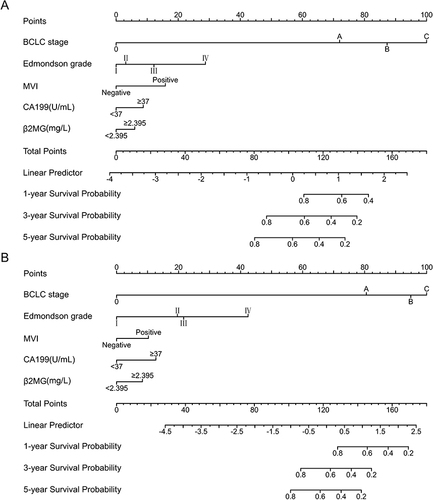
Figure 4 Evaluation of the performance of the nomograms in the training cohort and validation cohort. (A) Calibration curves of the nomogram predicting 1-, 3- and 5-year OS in the training cohort. (B) Calibration curves of the nomogram predicting 1-, 3- and 5-year OS in the validation cohort. (C) ROC curves of the nomogram predicting 1-, 3- and 5-year OS in the training cohort. (D) ROC curves of the nomogram predicting 1-, 3- and 5-year OS in the validation cohort.
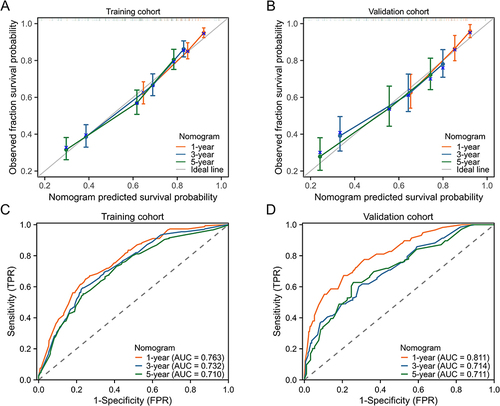
Figure 5 Decision curve analysis for 5-year survival predictions. (A) The decision curve of the training cohort; (B) The decision curve of the validation cohort.
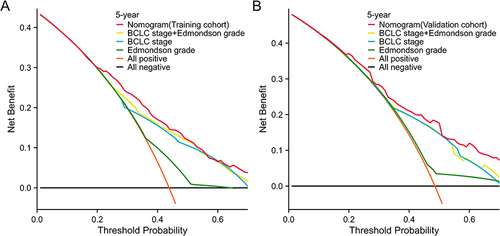
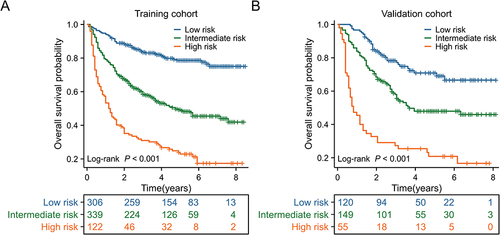
Figure 6 Survival graph for all three groups based on the predictor from the nomogram model. (A) Kaplan-Meier curve in the training cohort. (B) Kaplan-Meier curve in the validation cohort.