Figures & data
Figure 1 Flow diagram of the study selection process.
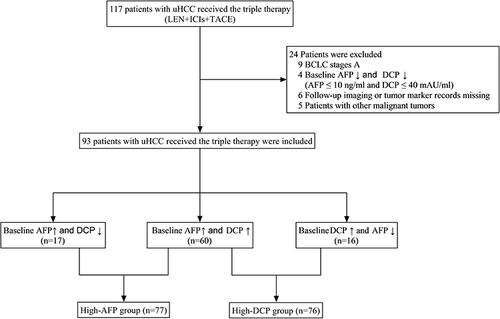
Table 1 Univariate Analysis for Objective Response Rates in the High-AFP Group (n=77)
Table 2 Univariate and Multivariate Analysis for Objective Response Rates in the High-DCP Group (n=76)
Figure 2 The survival curves of patients with uHCC receiving triple therapy for progression-free survival (PFS). (A) After 6 weeks of triple therapy, patients with AFP reduction >50% have significantly longer PFS than those with AFP reduction ≤50%. (B) Similarly, patients with DCP reduction >50% also had better PFS.
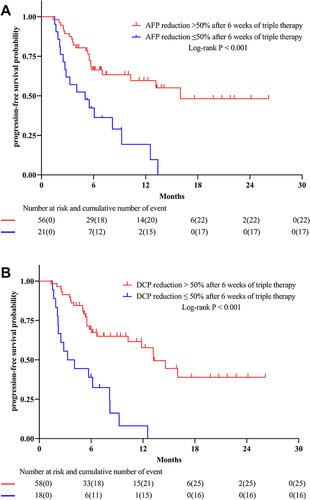
Table 3 Univariate and Multivariate Analysis for Overall Survival in the High-AFP Group (n=77)
Table 4 Univariate and Multivariate Analysis for Overall Survival in the High-DCP Group (n=76)
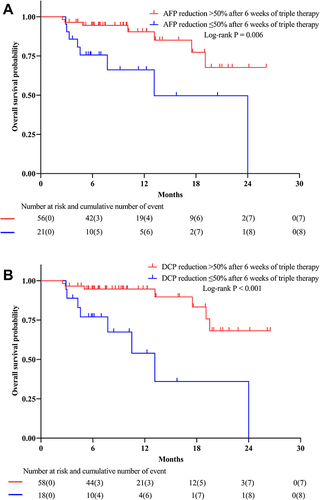
Figure 3 The survival curves of patients with uHCC receiving triple therapy for overall survival (OS). (A) After 6 weeks of triple therapy, patients with AFP reduction>50% have significantly improved OS compared to those without. (B) Likewise, the OS of patients with DCP reduction >50% was significantly longer.