Figures & data
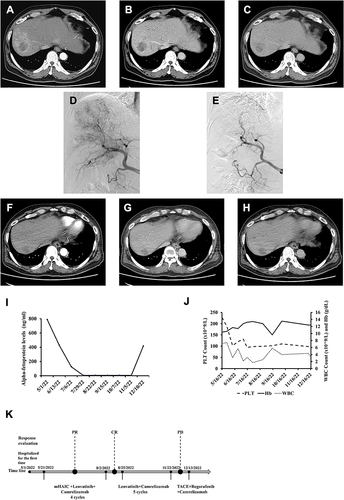
Figure 1 Changes in case 1 in imaging and laboratory tests during clinical treatment. Enhanced CT images before introducing mHAIC. A 14×11 cm mass is shown in the right liver in the arterial phase (A), portal phase (B) and delayed phase (C). Enhanced CT images after introducing mHAIC. (D) DSA via an implantable port-catheter system, before mHAIC, demonstrated large tumour stains of HCC. (E) The subphrenic artery develops from the beginning of the renal artery and supplies blood to the tumour area. (F and G) After 4 cycles of mHAIC, DSA clipping of the hepatic and subphrenic arteries showed no tumour staining. A 7×6 cm mass is shown in the right liver in the arterial phase (H), portal phase (I) and delayed phase (J). (K) AFP level changes during postoperative mHAIC. (L) Changes in WBC, PLT, and HGB of patients during treatment. (M) Timeline of the treatment process.
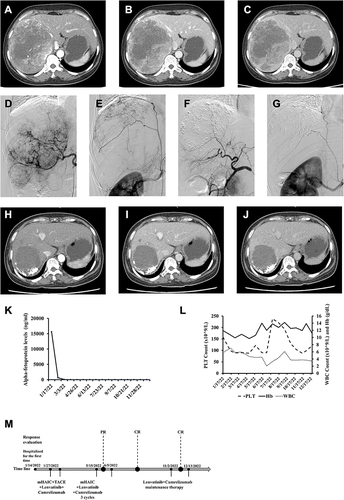
Figure 2 Changes in case 2 in imaging and laboratory tests during clinical treatment. Enhanced CT images before introducing mHAIC. A 6×5 cm mass is shown in the right liver in the arterial phase (A), portal phase (B) and delayed phase (C). (D) Hepatic angiography showing the thread and streaks sign, which implies a vascularized tumour thrombus. (E) After 4 cycles of mHAIC, DSA clipping of the hepatic arteries showed no tumour staining. Enhanced CT images after introducing mHAIC. A 2.0×1.5 cm mass is shown in the right liver in the arterial phase (F), portal phase (G) and delayed phase (H). (I) AFP level changes during postoperative mHAIC. (J) Changes in WBC, PLT and HGB of patients during treatment. (K) Timeline of the treatment process.