
Figures & data
Figure 1 Patient flow chart.
Abbbreviations: HCC, hepatocellular carcinoma; MWA, microwave ablation; TACE, transarterial chemoembolization.
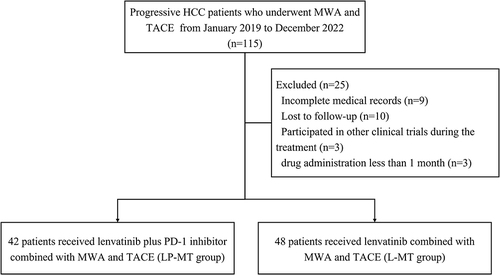
Table 1 Baseline Characteristics of the Patients with pHCC
Figure 2 Kaplan–Meier curves of progression-free survival and overall survival in the total population (a), pHCC patients with BCLC B (b) and pHCC patients with BCLC C (c).
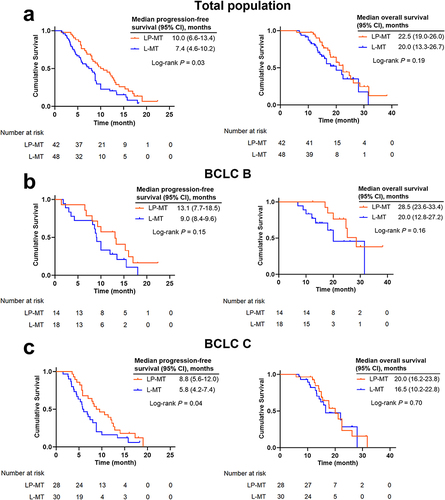
Table 2 Overall Tumor Response in the Total and Subgroups
Table 3 Univariate and Multivariate Analysis of PFS and OS
Table 4 Treatment-Related Adverse Events
Data Sharing Statement
The data used in this study are available from the corresponding author on reasonable request.