Figures & data
Figure 1 Study design and methods. (A) Woodchucks were infected with woodchuck hepatitis virus (WHV) as newborns. At the age of 18–24 months, woodchucks were imaged with computed tomography. Ultrasound guided cryoablation was performed on three animals. Cryoablated woodchucks were imaged and euthanized 14 days after treatment. Whole blood was collected, liver and tumors were sectioned and formalin preserved, and peripheral blood mononuclear cells (PBMC) were purified. (B) Tumors were stained for CD3, CD4, NCAM and FOXP3 markers. Immunohistochemical quantification was performed on 5 distinct regions. Three regions were in the ablated tumors: 1. Ablation margin 2. Ablation zone, and 3. Unablated region. The fourth region was located within a separate, untreated tumor (UT) in ablated animals. The fifth region was located in tumors within control, untreated animals (CT) n=9. (C) PBMC were purified from whole blood, labeled, cultured with immune-modulating drugs for 4 days and stained with CD3 and CD4 antibodies. FACS analysis was performed and data analyzed for cell replication (n=3 cryoablated animals, n=5 control infected animals, n=2 control uninfected animals).
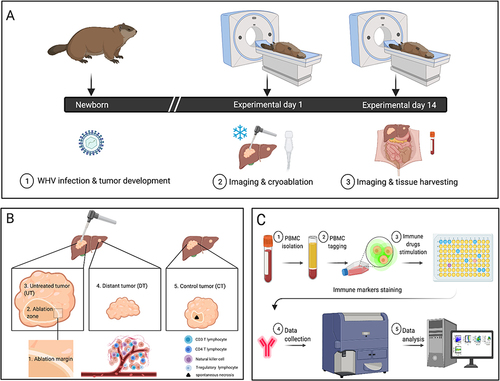
Table 1 Differences in TUNEL and Immune Stains Between Regions (Least-Squares Mean, Standard Error, and Confidence Interval for the Difference, and p-value from Testing Whether the Difference Equals 0)
Table 2 Standardized Replication Index (sRI) by Cohort, Stain and Drug (Least-Squares Mean, Confidence Interval, and p-value from Testing Whether the sRI Equals 1)
Table 3 Standardized Replication Index (sRI) for Non-CD3+, CD3+, and CD4+, by Cohort, Animal and Drug (Least-Squares Mean and p-value from Testing Whether the sRI Equals 1)
Figure 2 Cryolesion architecture on H&E and TUNEL stains. (A) Representative H&E-stained sections of the 3 cryolesions. In the left panel a defined cryolesion with central coagulative necrosis surrounded with a homogenous rim is demonstrated. The middle panel demonstrates a cryolesion with apparent hemorrhage along the needle track and less homogeneous cryolesion rims (reprinted from.Citation19 with permission). The right panel shows the ablation zone with liquefactive necrosis surrounded by a rim of cell debris that can be found in the central ablation zone as well as in the periphery. Magnified (B) H&E-stained and (C) TUNEL stained sections of the regions marked in (A) delineating the 3 compartments within the cryolesion: central necrosis (1), cell debris rim (2) and coagulative necrosis outer rim (3). Tumor tissue that was not cryoablated is marked with UT (untreated tumor). TUNEL stain annotation was performed on 4 regions. Two regions in the ablated tumor, the ablation zone and untreated tumor (UT), are shown on panel (D). Spontaneous necrosis and control tumor (CT) in untreated animals were evaluated as well both regions represented in panel (E). (F) TUNEL stain quantification, control animals N=7, cryoablated animals N=3, 1–2 sections per animal, p-value for the entire test is shown on the graph. P-values between pairs of regions are summarized in .
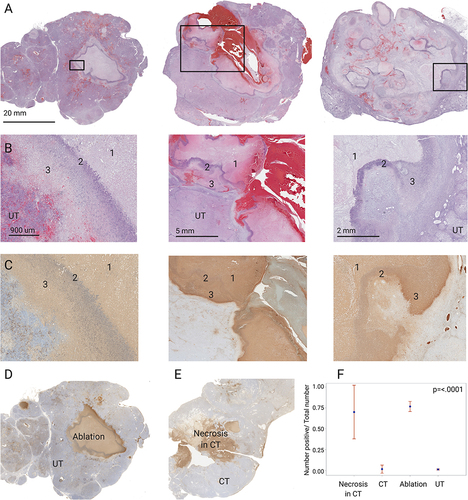
Figure 3 Local immune effects evaluated with immune cell distribution and quantification within the cryolesions. Rows demonstrate immunohistochemical expression and quantification of immune infiltrates, from top to bottom: CD3+, CD4+, NCAM (natural killers’ cells) and FOXP3 (T-regulatory cells). Whole mount sections for each stain are shown in the left column with magnification of the cryolesion margin zone in the center column. Quantification for each immune stain by regions as defined in methods and is represented on the right column. Control animals N=5, cryoablated animals N=3, 1–2 sections per animal, p-values for the entire test are shown on the graphs. P-values between pairs of regions are summarized in .
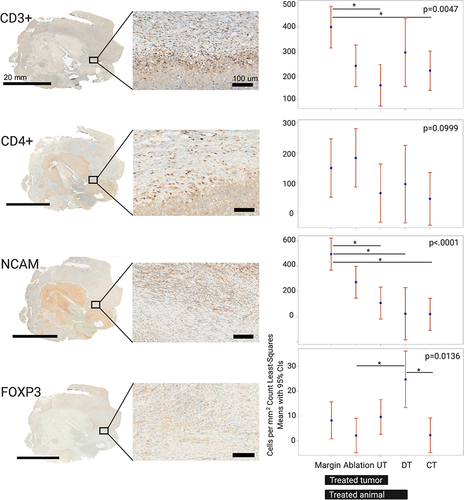
Figure 4 Replication magnitude of PBMC upon nonspecific stimulation in naïve, chronically infected, and cryoablated woodchucks. Evaluation of lymphocyte replication using carboxyfluorescein succinimidyl ester (CFSE) assay in naïve, chronically infected and cryoablated woodchucks for non-CD3+, CD3+, and CD4+ cells. Data represent mean ± SEM. *p<0.05 one-way ANOVA.
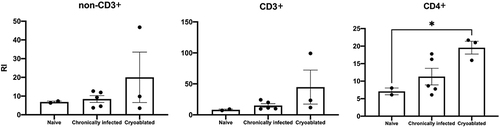
Figure 5 Immune-modulating drug effects on PBMC replication. Evaluation of drug-induced lymphocyte replication using carboxyfluorescein succinimidyl ester (CFSE) assay in naïve, chronically infected and cryoablated woodchucks. The standardized replication index (sRI) is presented for all drugs for non-CD3+ (A), CD3+ (B), and CD4+ (C) sub-populations. The test of whether the sRIs were greater than 1 was based on a t-test applied to the sRI’s least-squares means and their corresponding standard error, which were obtained from the statistical models. The significant differences between groups were calculated by one-way ANOVA (Tukey’s multiple comparison test). p<0.05 was considered as statistically significant and marked by *P-values are summarized in . BMS= BMS-202; DSR= DSR-6434; GS= GS-9620; Gard= gardiquimod.
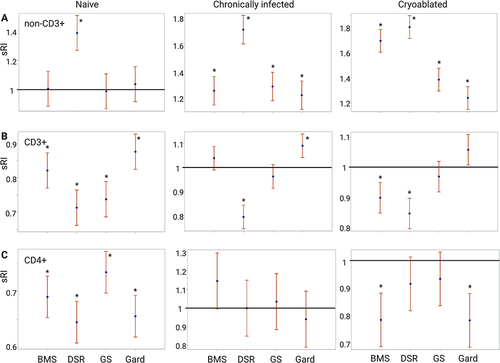
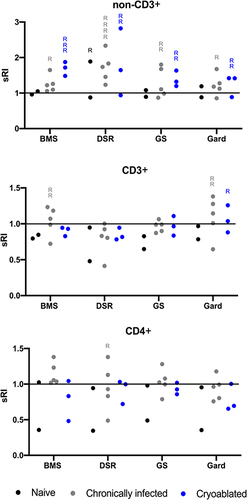
Figure 6 Systemic immune responses by individuals. PBMC from individual woodchucks were evaluated for responses to four experimental immune-modulating drugs. Each combination of woodchuck PBMC sample and a drug comprised a test. Responses were defined as any test with standardized replication index (sRI) least-squares mean greater than 1 and unadjusted p-value < 0.0025 (= 0.05/20 tests). Drug concentrations for each animal were combined and every dot represents the mean sRI. Samples from the same animal cohort are color coded. Any test that fulfilled the response criteria was marked with “R”. For example, in the non-CD3+ cell population (top graph) upon DSR 6434 stimulation, 1, 4 and 2 responses were found in the naïve, chronically infected untreated, and the cryoablated woodchucks, respectively. BMS= BMS-202; DSR= DSR-6434; GS= GS-9620; Gard= gardiquimod.