Figures & data
Figure 1 Expression of CKS2 in pancarcinoma and HCC. (A) The expression level of CKS2 in different tumor types was analyzed using TIMER database based on TCGA database. Statistical significance was indicated by *P< 0.05, **P< 0.01 and ***P< 0.001. (B) CKS2 expression in HCC and non-cancerous paracancerous tissues in the HCCDB.
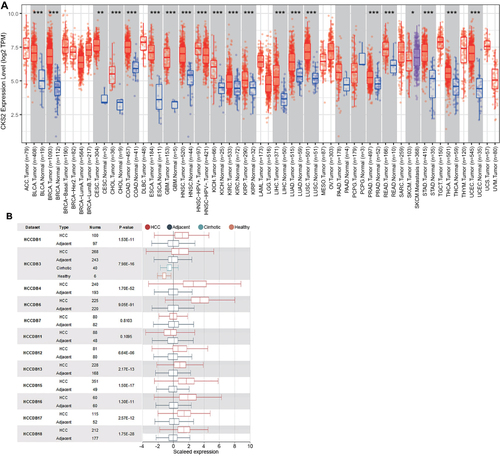
Figure 2 Expression of CKS2 in HCC patients with different pathological grades and stages. (A) CKS2 expression in normal tissues and HCC tissues of varying grades. (B) CKS2 expression in normal tissues and different stages of HCC tissues. *** P<0.001 showed statistical significance.
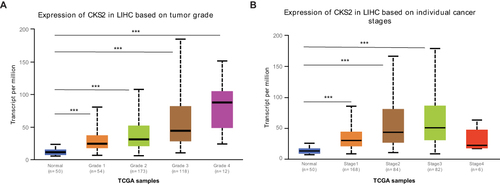
Figure 3 The value of CKS2 expression for prognosis in HCC. (A) Overall survival (OS) and (B) disease-free survival (DFS) from the TCGA database for the LIHC.
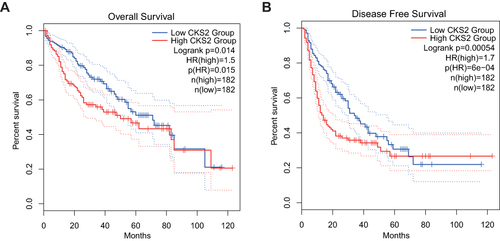
Figure 4 Methylation of CKS2 in HCC. (A) Expression of CKS2 gene methylation at different CpG sites in normal and tumor tissues. (B) Correlation between CKS2 expression and methylation levels at different CpG sites. (C) Prognostic values of cg14307853 and cg13651859 in CKS2 in HCC (The “high” and “low” groups of methylation sites were obtained from the cut-off values of 50% of the methylation levels of methylation sites in the CKS2 of HCC patients. The survival module in the SMART web for analyzing DNA methylation in the TCGA database is used to analyze their correlation with patient survival).
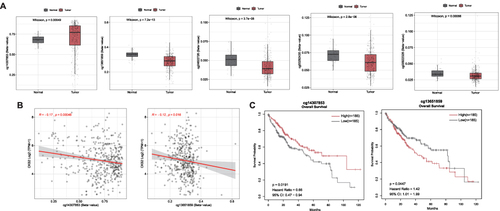
Figure 5 Functional annotations. (A) Heatmap shows the top 50 genes that are positively associated with CKS2. Enrichment studies of (B) GO and (C) KEGG for genes associated with CKS2. CC – cellular component; BP – biological process; MF – molecular function; (D) Enriched GO annotations of CKS2 in LIHC from the TCGA database by GSEA. (E) Enrichment of negatively associated genes in the pathway for the acute inflammatory response.
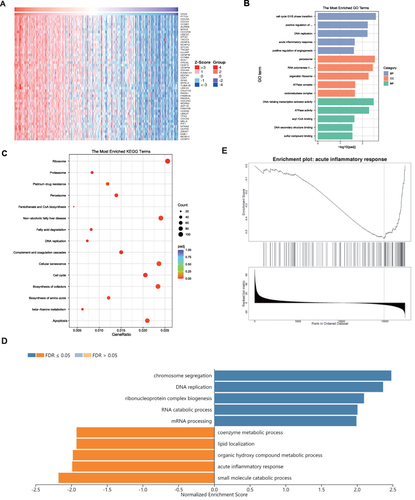
Figure 6 CKS2 is correlated with immune cell infiltration levels. (A) The positive correlation between CKS2 expression and infiltrating levels of (B) cells, CD8+ T cells, CD 4+ T cells, and macrophage cells, as evaluated by the TIMER database. The CKS2 expression in (B) proliferative CD8+ T cells and (C) exhausted CD8+ T cells.
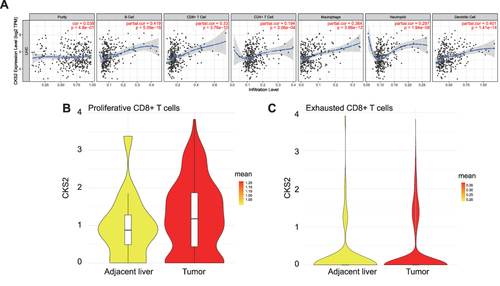
Table 1 Correlation Analysis Between CKS2 and Related Immune Markers
Figure 7 Correlation of CKS2 expression level with immunomodulators.
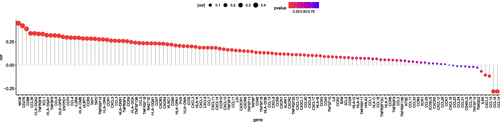
Figure 8 CKS2 suppress immune activity in HCC. (A) Correlation between CKS2 expression and seven steps of immune cycle. (B) Correlation of CKS2 with inhibitory characteristic immune checkpoints. PDL1 (CD274), PD1 (PDCD1).The values and color show the Pearson correlation coefficient. Asterisks displayed using the Pearson test algorithm represent the magnitude of a statistically significant P-value (*P < 0.05; **P < 0.01; ***P < 0.001; ****P < 0.0001).
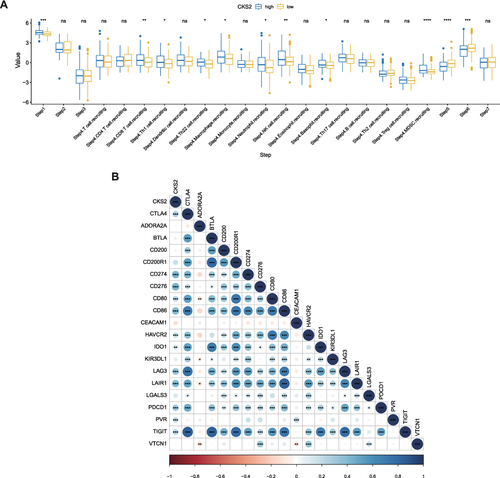
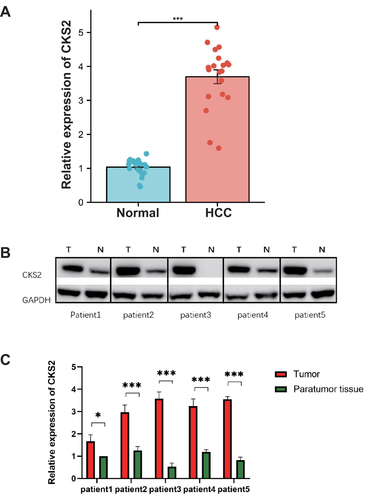
Figure 9 CKS2 expression in paracancerous tissues and tumor tissues as detected by qRT-PCR and Western blot. (A) qRT-PCR analysis of the expression of the CKS2 protein in paracancerous tissues and tumor tissues in HCC. (B) Western blot pictures showing HCC tumor tissue and paracancerous tissue expressing the CKS2 protein. (C) Western blot analysis of the expression of the CKS2 protein in tumor and paracancerous tissue in HCC. (*P < 0.05; ***P < 0.001).