Figures & data
Table 1 Baseline Characteristics of the Patients Included in the Analysis
Table 2 Response Assessment and Time to Treatment Failure in the First, Second, and Third Lines
Figure 1 Plot illustration representing the duration of each line of systemic treatment and systemic treatment free interval individually.
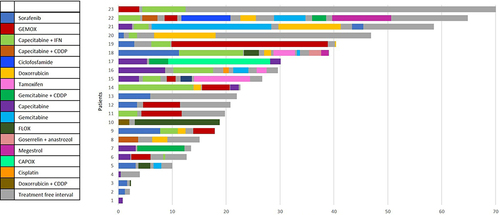
Table 3 Median Survival and Univariate Analysis
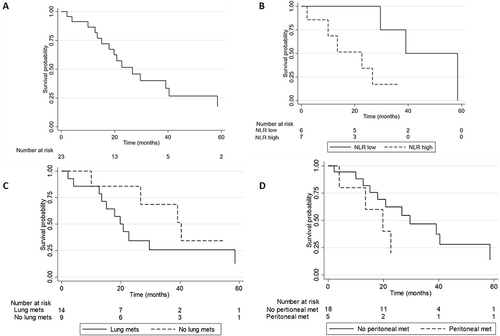
Figure 2 Survival curves (A) Total cohort; (B) Neutrophil-to-lymphocyte ratio (NLR) high versus low (p=0.02); (C) Peritoneal metastasis (Peritoneal mets) yes versus no (p=0.07); (D) Lung metastasis (Lung mets) yes vs no (p=0.09).