
Figures & data
Table 1 OAR Constraints for 10- and 15-Fraction Regimens
Figure 1 Two representative cases of hepatocellular carcinoma treated with CIRT using different fractionation regimens. The first case: (A) T2-weighted and hepatic arterial phase T1-weighted MRI before CIRT. (B) Dose distribution of the CIRT plan with a prescription relative biological effectiveness-weighted dose of 67.5 Gy in 15 fractions. (C) Follow-up MRI at 45 months after CIRT demonstrated disappearance of the intrahepatic mass. The second case: (D) Baseline MRI before CIRT. (E) Dose distribution with a prescription of 55 Gy in 10 fractions. (F) The MRI taken 51 months after CIRT showing a clinically complete response.
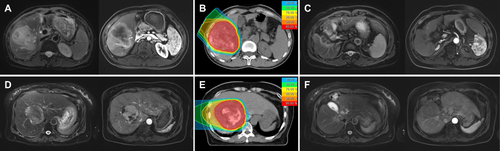
Table 2 Patient and Treatment Characteristics
Figure 2 Kaplan–Meier curves for overall survival (OS), local control (LC), elsewhere liver recurrences-free survival (ELRFS), distant metastasis-free survival (DMFS) and progression-free survival (PFS).
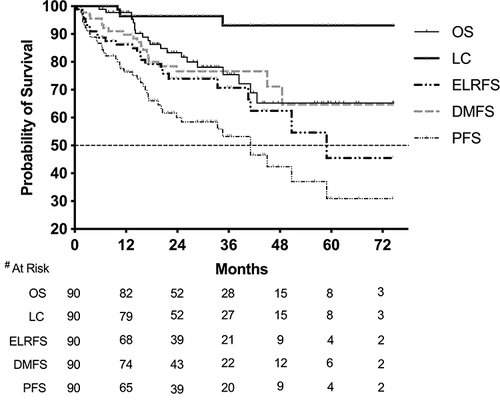
Table 3 Two-Year Clinical Outcomes of Prognostic Factors
Table 4 Acute and Late Toxicities