Figures & data
Figure 1 Study flow diagram.
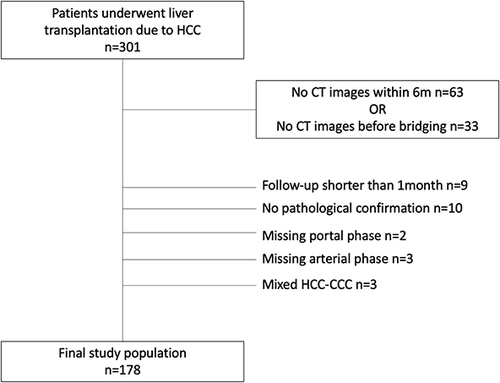
Table 1 Summary of Baseline Characteristics and Imaging Features of Patients
Figure 2 Kaplan–Meier curves comparing time-to-recurrence. (a) tumor margin (p=0.023), (b) presence of satellite nodules (p=0.02), (c) presence of small lesions (p=0.031), (d) peritumoral enhancement (p<0.001), (e) diameter of largest tumor (p<0.001), (f) number of tumors (p<0.001), (g) history of bridging therapies (p<0.001).
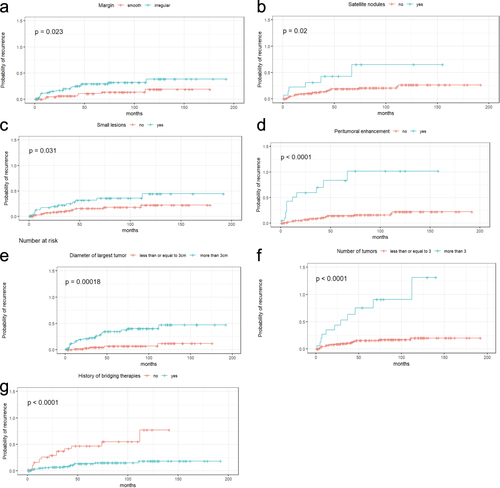
Table 2 Univariable Cox Proportional Hazards Regression Analysis for Prediction of the Recurrence of HCC After Transplantation
Figure 3 Multivariable Cox proportional hazards regression analysis of variable selected by LASSO for prediction the recurrence of HCC after transplantation.
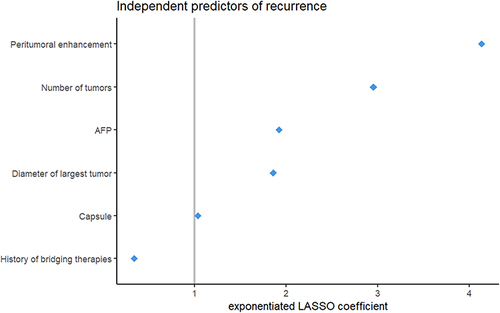
Figure 4 The nomogram for predicting 1-, 3-, and 5-year time-to-recurrence probabilities.
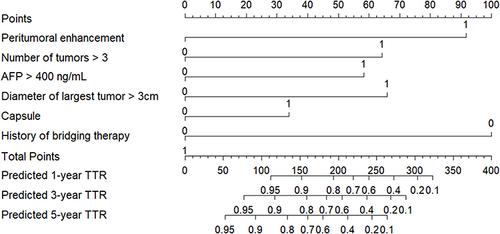
Figure 5 Calibration curves of the nomogram for predicting 1-, 3-, and 5-year time-to-recurrence probabilities.
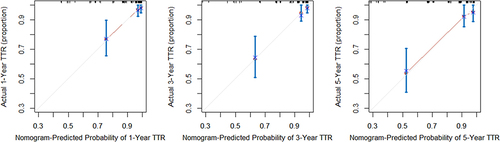
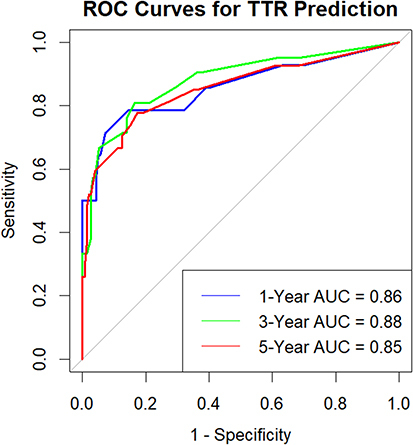
Figure 6 Receiver operating characteristic (ROC) curves of 1- (blue line), 3- (green line), and 5-year (red line) time-to-recurrence based on the nomogram.