
Figures & data
Table 1 Comparison of Baseline Parameters Between CRP Flare-Responders, CRP Responders and CRP Non-Responders
Figure 1 Distribution of baseline CRP across different CRP kinetics groups.
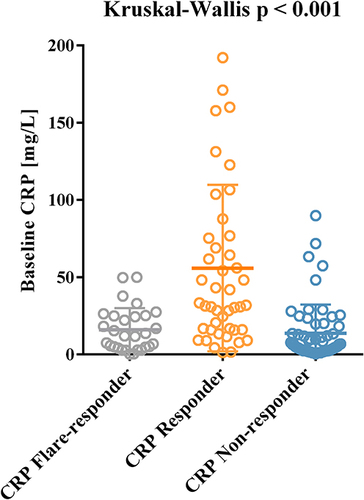
Table 2 Efficacy According to Different Early CRP Kinetics
Figure 2 Distribution of response at first staging according to RECIST v1.1 among the different CRP kinetics groups. P value based on Chi-square test for ORR (a) and DCR (b).
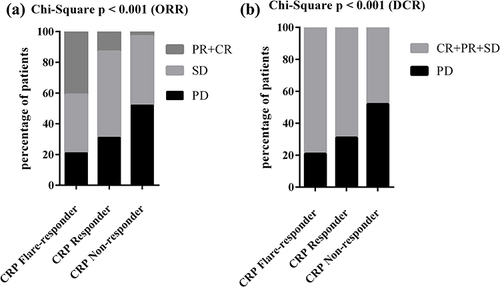
Figure 3 Kaplan-Meier survival curves showing the progression-free survival (PFS) (a) and overall survival (OS) (b) after ICB initiation stratified according to CRP kinetics groups.
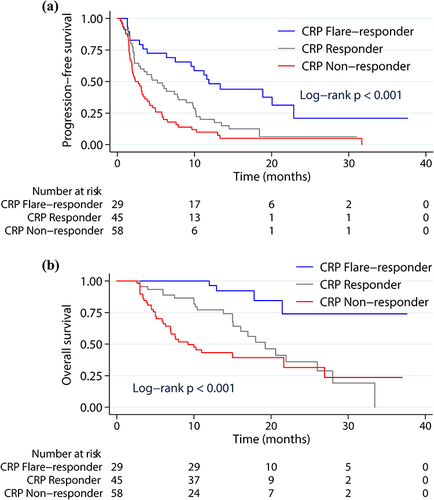
Table 3 Univariable and Multivariable Cox Regression Analyses of Risk Factors for Progression-Free Survival
Table 4 Univariable and Multivariable Cox Regression Analyses of Risk Factors for Overall Survival