Figures & data
Table 1 Patient Characteristics
Table 2 Tumor Characteristics and Treatment Efficacy
Figure 1 Changes in tumor size and AFP levels in patients with HCC after the combination of HAIC with TKIs and anti-PD-1 antibodies. (a) Dot plot of the change in tumor size from baseline assessed based on RECIST. (b) Histogram of the best percentage change in tumor size from baseline assessed based on RECIST. Each bar represents one patient. (c) Dot plot of the change in AFP from baseline to preoperation.
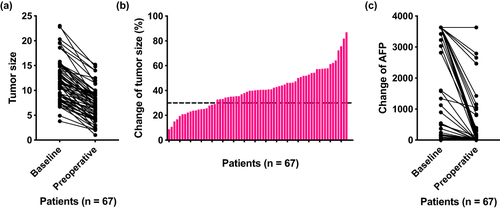
Figure 2 One representative case. (a) Pretreatment CT showing a large tumor with tumor thrombosis in right and main branches of portal vein. (b) Preoperative MRI showing the regression of intrahepatic tumor and tumor thrombosis after treatment. (c) Resected specimen of patients.
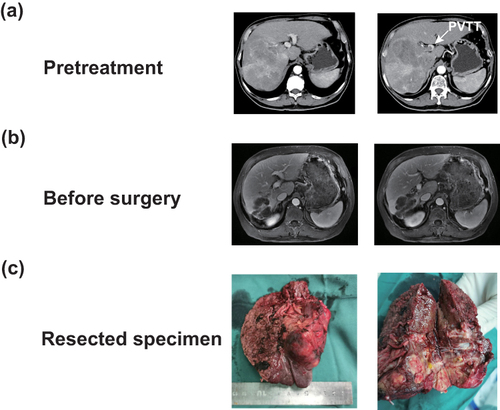
Table 3 Surgical Characteristics
Table 4 Pathological Characteristics
Table 5 Univariate and Multivariate Analyses of Variables Associated with Recurrence-Free Survival
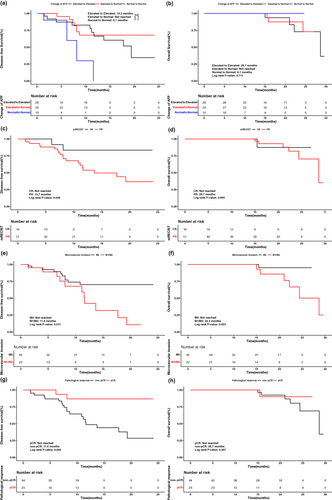
Figure 3 Survival analyses of patients with HCC who treated with HAIC combined with TKIs and anti-PD-1 antibodies. DFS (a) and OS (b) of all patients. DFS (c) and OS (d) of patients with different change of AFP. DFS (e) and OS (f) of patients with CR and PR based on mRECIST. DFS (g) and OS (h) of patients with M0 and M1/M2 in MVI. DFS (i) and OS (j) of patients with pCR and non-pCR.