
Figures & data
Table 1 Demographic Characteristics of the Patients
Table 2 Therapeutic Response to HAIC Combined with Lenvatinib and Camrelizumab
Figure 1 Kaplan-Meier curve for progression-free survival (a) and overall survival (b) for all patients receiving combination therapy of HAIC and lenvatinib plus camrelizumab. Kaplan-Meier curves of progression-free survival (c) and overall survival (d) for patients stratified by NLR.
Abbreviation: NLR, neutrophil-to-lymphocyte ratio.
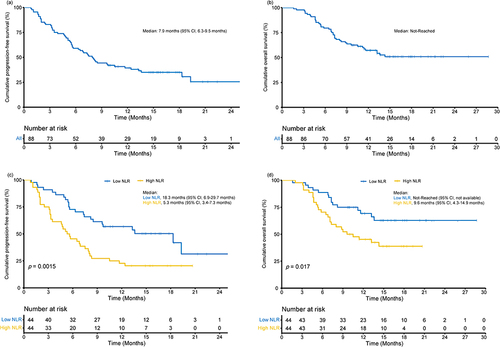
Figure 2 Forest plot for univariate and multivariate analysis of factors that influenced overall survival.
Abbreviations: HR, hazard ratio; CI, confidence interval; mALBI, modified albumin-bilirubin; AFP, alpha-fetoprotein; HCC, hepatocellular carcinoma; BCLC, Barcelona Clinic Liver Cancer; NLR, neutrophil-to-lymphocyte ratio.
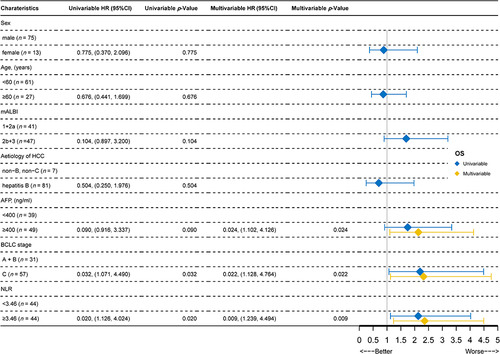
Figure 3 Forest plot for univariate and multivariate analysis of factors that influenced progression-free survival.
Abbreviations: HR, hazard ratio; CI, confidence interval; mALBI, modified albumin-bilirubin; AFP, alpha-fetoprotein; HCC, hepatocellular carcinoma; BCLC, Barcelona Clinic Liver Cancer; NLR, neutrophil-to-lymphocyte ratio.
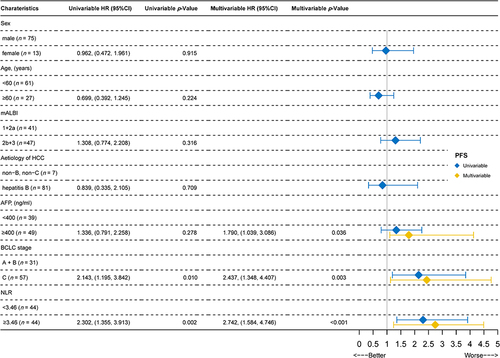
Table 3 Sequential Therapy After Progression