Figures & data
Figure 1 Protocol of this study.
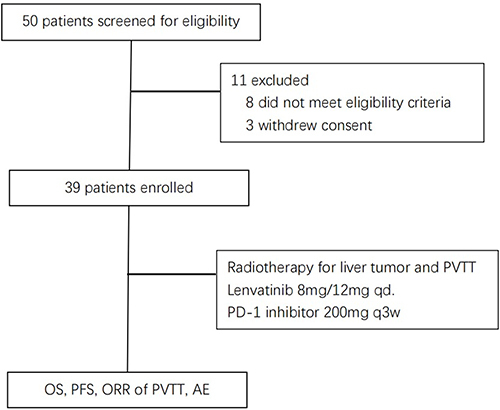
Table 1 Patient Demographics and Clinical Characteristics
Table 2 Radiological Response of PVTT According to mRECIST
Figure 2 OS and PFS.
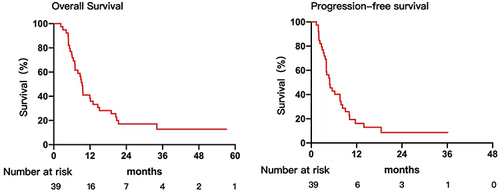
Figure 3 Patients survival information.
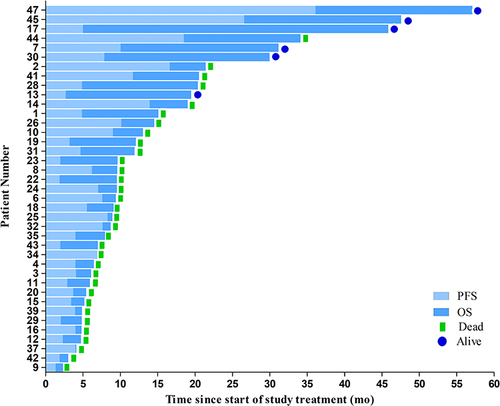
Figure 4 Typical case demonstration. A 69-year-old male HCC patient with main PVTT achieved complete response (mRECIST) after receiving Lenvatinib plus Pembrolizumab combined with Radiotherapy. Sub-figure A B C show the pre-treatment images and sub-figure D E F show the post-treatment images. Sub-figure G H show the radiotherapy target area. The red arrows in the sub-figure A and C indicate the range of PVTT before treatment. The red arrow in the sub-figure B indicate the range of liver tumor before treatment. The red arrows in the sub-figure D and F indicate the range of PVTT after treatment. The red arrow in the sub-figure E indicate the range of liver tumor after treatment. After treatment, the liver tumor and PVTT had shrunk and there was no enhancement on the enhanced image.
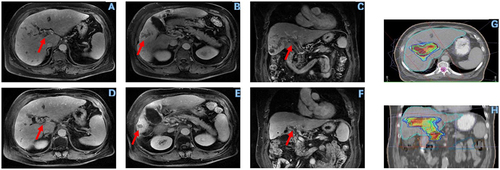
Table 3 Treatment Related Adverse Events
Table 4 Univariate and Multivariate Analyses of Prognostic Factors Affecting OS
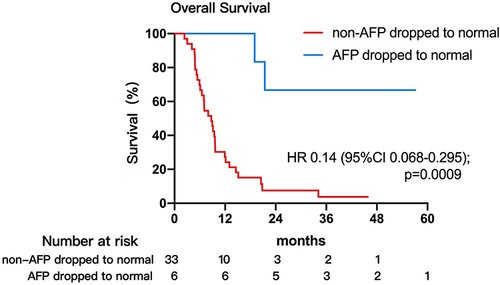
Figure 5 Independent risk factor for OS.