Figures & data
Figure 1 LEAWBIH was increased and correlated with poor overall survival in HCC. (A) The correlation between LEAWBIH (RP4-773N10.4) expression and overall survival based on the TCGA-LIHC RNA-seq data, analysed by the online tool GEPIA. (B) LEAWBIH expression in 371 HCC tissues and 50 normal liver tissues, based on the TCGA-LIHC RNA-seq data. Results are presented as median with interquartile range. P < 0.0001 by Mann-Whitney test. (C) LEAWBIH expression in 257 HCC tissues with stage I–II, and 90 HCC tissues with stage III–IV, based on the TCGA-LIHC RNA-seq data. Results are presented as median with interquartile range. P = 0.0461 by Mann-Whitney test. (D) LEAWBIH expression in 73 pairs of HCC tissues and matched adjacent liver tissues was measured by qPCR. Results are presented as median with interquartile range. P < 0.0001 by Wilcoxon matched-pairs signed rank test. (E) Kaplan-Meier survival analysis of the correlation between LEAWBIH expression and overall survival in our HCC cohort containing 73 cases. HR = 1.902, P = 0.0422 by log-rank test. (F) LEAWBIH expression in immortalized liver cell line THLE-2 and HCC cell lines SK-HEP-1, HuH-7, and Hep3B was measured by qPCR. Results are presented as mean ± standard deviation (SD) of 3 independent experiments. ****P < 0.0001 by one-way ANOVA followed by Dunnett’s multiple comparisons test.
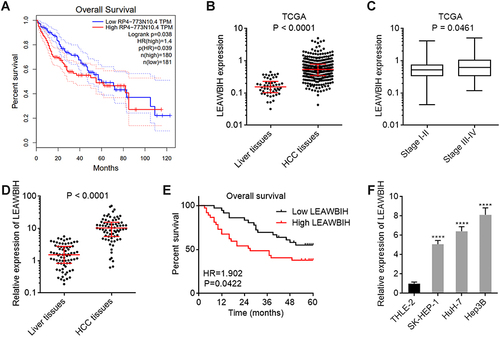
Figure 2 m6A modification increased LEAWBIH transcript stability. (A) MeRIP assays followed by qPCR were performed in SK-HEP-1, HuH-7, and Hep3B cells to detect m6A-modified LEAWBIH. (B and C) m6A modification levels of 2095 (B) and 2679 (C) sites of LEAWBIH in SK-HEP-1, HuH-7, and Hep3B cells with METTL3 or FTO overexpression were measured by SELECT. (D–F) LEAWBIH transcript stability over time was measured after blocking new RNA synthesis with α‑amanitin (50 µM) in SK-HEP-1 (D), HuH-7 (E) or Hep3B (F) cells with METTL3 or FTO overexpression. For (A–F), results are presented as mean ± SD of 3 independent experiments. *P < 0.05, **P < 0.01, ***P < 0.001 by Student’s t-test (A) or one-way ANOVA followed by Dunnett’s multiple comparisons test (B-F). (G–I) The correlation between LEAWBIH expression and METTL3 (G), METTL14 (H), or WTAP (I) expression in 371 HCC tissues, based on the TCGA-LIHC RNA-seq data. r and P values were calculated by Spearman correlation analysis.
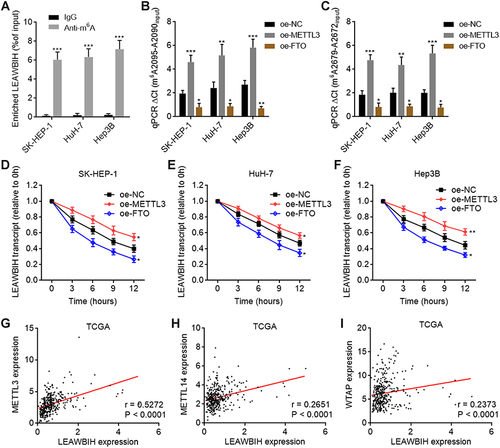
Figure 3 m6A modification level of LEAWBIH was increased and correlated with poor overall survival in HCC. (A and B) m6A modification levels of 2095 (A) and 2679 (B) sites of LEAWBIH in 73 pairs of HCC tissues and matched adjacent liver tissues was measured by SELECT. Results are presented as median with interquartile range. P < 0.0001 by Wilcoxon matched-pairs signed rank test. (C and D) Kaplan-Meier survival analysis of the correlation between m6A modification levels of 2095 (C) and 2679 (D) sites of LEAWBIH and overall survival in our HCC cohort containing 73 cases. HR and P values were calculated by log-rank test. (E and F) The correlation between LEAWBIH expression and m6A modification levels of 2095 (E) or 2679 (F) sites of LEAWBIH in HCC tissues. n = 73, r and P values were calculated by Spearman correlation analysis. (G and H) m6A modification levels of 2095 (G) and 2679 (H) sites of LEAWBIH in immortalized liver cell line THLE-2 and HCC cell lines SK-HEP-1, HuH-7, and Hep3B was measured by SELECT. Results are presented as mean ± SD of 3 independent experiments. *P < 0.05, **P < 0.01, ***P < 0.001 by one-way ANOVA followed by Dunnett’s multiple comparisons test.
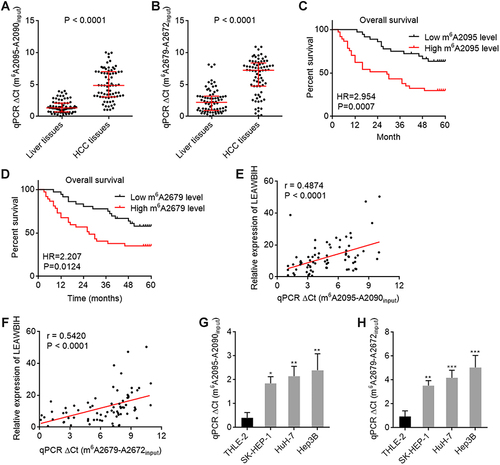
Figure 4 LEAWBIH promoted cell proliferation, migration, and invasion in an m6A dependent manner. (A and B) LEAWBIH expression in HuH-7 (A) and SK-HEP-1 (B) cells with stable overexpression of wild-type or m6A-modified 2095 and 2679 sites mutated LEAWBIH was detected by qPCR. (C and D) Cell viability of HuH-7 (C) and SK-HEP-1 (D) cells with overexpression of wild-type or mutated LEAWBIH was measured by Glo cell viability assay. (E) Cell proliferation of HuH-7 and SK-HEP-1 cells with overexpression of wild-type or mutated LEAWBIH was measured by EdU incorporation assay. Scale bars, 200 µm. (F) Cell migration of HuH-7 and SK-HEP-1 cells with overexpression of wild-type or mutated LEAWBIH was measured by transwell migration assay. Scale bars, 100 µm. (G) Cell invasion of HuH-7 and SK-HEP-1 cells with overexpression of wild-type or mutated LEAWBIH was measured by transwell invasion assay. Scale bars, 100 µm. Results are presented as mean ± SD of 3 independent experiments. *P < 0.05, **P < 0.01, ****P < 0.0001, ns, not significant, by one-way ANOVA followed by Dunnett’s multiple comparisons test.
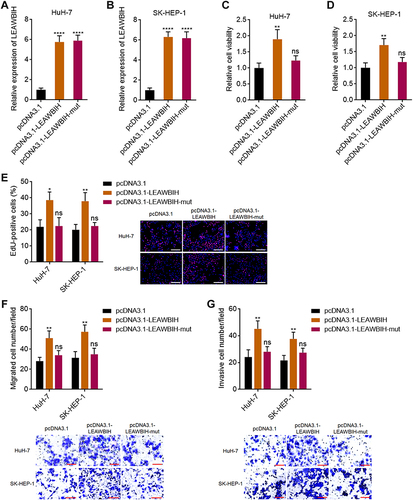
Figure 5 Knockdown of LEAWBIH repressed cell proliferation, migration, and invasion. (A and B) LEAWBIH expression in HuH-7 (A) and Hep3B (B) cells with stable knockdown of LEAWBIH was detected by qPCR. (C and D) Cell viability of HuH-7 (C) and Hep3B (D) cells with knockdown of LEAWBIH was measured by Glo cell viability assay. (E) Cell proliferation of HuH-7 and Hep3B cells with knockdown of LEAWBIH was measured by EdU incorporation assay. Scale bars, 200 µm. (F) Cell migration of HuH-7 and Hep3B cells with knockdown of LEAWBIH was measured by transwell migration assay. Scale bars, 100 µm. (G) Cell invasion of HuH-7 and Hep3B cells with knockdown of LEAWBIH was measured by transwell invasion assay. Scale bars, 100 µm. Results are presented as mean ± SD of 3 independent experiments. *P < 0.05, **P < 0.01, ***P < 0.001 by one-way ANOVA followed by Dunnett’s multiple comparisons test.
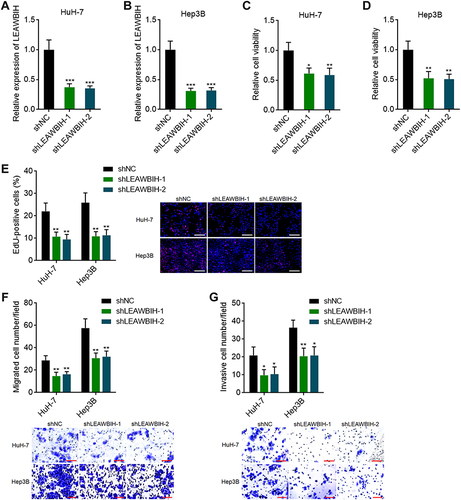
Figure 6 m6A-modified LEAWBIH activated Wnt/β-catenin signaling. (A) GSEA of HCC subclass S1 and Wnt/β-catenin signaling gene signatures in LEAWBIH high expression group versus LEAWBIH low expression group. NES, normalized enrichment score. (B and C) β-catenin reporter TOPFlash was co-transfected with pRL-TK into HuH-7 cells with overexpression of wild-type or mutated LEAWBIH (B) or HuH-7 cells with knockdown of LEAWBIH (C). Luciferase activities were measured 48 h after transfection. Results are presented as the relative ratio of firefly luciferase activity to Renilla luciferase activity. (D) The expression of Wnt/β-catenin targets in HuH-7 cells with overexpression of wild-type or mutated LEAWBIH was measured by qPCR. (E) The expression of Wnt/β-catenin signaling targets in HuH-7 cells with knockdown of LEAWBIH was measured by qPCR. For (B–E), results are presented as mean ± SD of 3 independent experiments. *P < 0.05, **P < 0.01, ns, not significant, by one-way ANOVA followed by Dunnett’s multiple comparisons test. (F–I) The correlation between LEAWBIH expression and Wnt/β-catenin signaling targets AXIN2 (F), LEF1 (G), CCND1 (H), or MYC (I) expression in 371 HCC tissues, based on the TCGA-LIHC RNA-seq data. r and P values were calculated by Spearman correlation analysis.
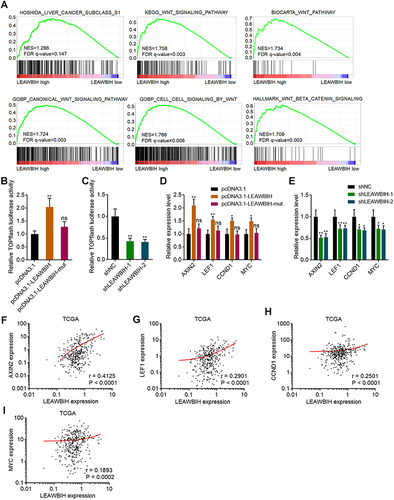
Figure 7 m6A-modified LEAWBIH epigenetically activated CTNNB1 expression. (A) The correlation between LEAWBIH and CTNNB1 expression in 371 HCC tissues, based on the TCGA-LIHC RNA-seq data. r = 0.4085, P < 0.0001 by Spearman correlation analysis. (B and C) The expression of CTNNB1 in HuH-7 cells with overexpression of wild-type or mutated LEAWBIH (B) or HuH-7 cells with knockdown of LEAWBIH (C) was measured by qPCR. (D) ChIRP assays with LEAWBIH antisense probes or control probes were conducted in HuH-7 cells to measure the binding of LEAWBIH to CTNNB1 promoter. GAPDH promoter was used as negative control. (E) ChIP assays with KDM3B or H3K9me2 specific antibodies were conducted in HuH-7 cells with overexpression of wild-type or mutated LEAWBIH to measure the binding of KDM3B to CTNNB1 promoter and H3K9me2 level at CTNNB1 promoter. (F) ChIP assays with KDM3B or H3K9me2 specific antibodies were conducted in HuH-7 cells with knockdown of LEAWBIH to measure the binding of KDM3B to CTNNB1 promoter and H3K9me2 level at CTNNB1 promoter. (G) ChIP assays with KDM3B or H3K9me2 specific antibodies were conducted in HuH-7 cells with overexpression of LEAWBIH and depletion of YTHDC1 to measure the binding of KDM3B to CTNNB1 promoter and H3K9me2 level at CTNNB1 promoter. (H) The expression of CTNNB1 in HuH-7 cells with overexpression of LEAWBIH and depletion of YTHDC1 was measured by qPCR. (I) The expression of CTNNB1 in HuH-7 cells with overexpression of LEAWBIH and depletion of KDM3B was measured by qPCR. Results are presented as mean ± SD of 3 independent experiments. *P < 0.05, **P < 0.01, ***P < 0.001, ns, not significant, by one-way ANOVA followed by Dunnett’s multiple comparisons test (B–F) or Student’s t-test (G-I).
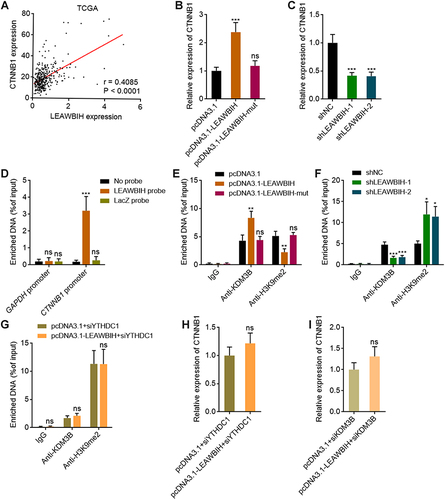
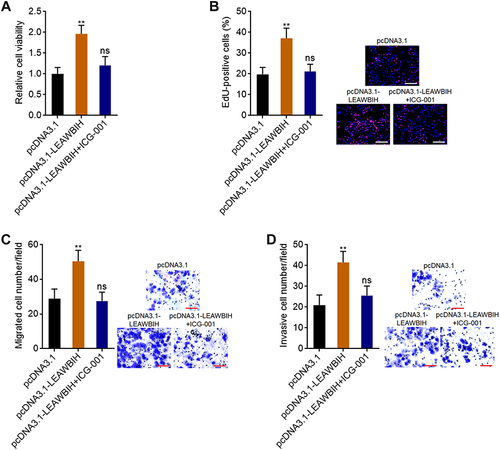
Figure 8 Blocking of Wnt/β-catenin signaling reversed the roles of LEAWBIH in promoting cell proliferation, migration, and invasion. (A) Cell viability of HuH-7 cells with overexpression of LEAWBIH treated with or without 5 μM ICG-001 was measured by Glo cell viability assay. (B) Cell proliferation of HuH-7 cells with overexpression of LEAWBIH treated with or without 5 μM ICG-001 was measured by EdU incorporation assay. Scale bars, 200 µm. (C) Cell migration of HuH-7 cells with overexpression of LEAWBIH treated with or without 5 μM ICG-001 was measured by transwell migration assay. Scale bars, 100 µm. (D) Cell invasion of HuH-7 cells with overexpression of LEAWBIH treated with or without 5 μM ICG-001 was measured by transwell invasion assay. Scale bars, 100 µm. Results are presented as mean ± SD of 3 independent experiments. **P < 0.01, ns, not significant, by one-way ANOVA followed by Dunnett’s multiple comparisons test.