Figures & data
Table 1 Baseline Differences Between Training and Validation Cohort
Table 2 Univariate and Multivariate Cox Regression Analyses of OS in Training Cohort
Figure 1 Nomogram for predicting the OS of unresectable hepatocellular carcinoma patients in the training cohort at 1-, 2-, and 3 years.
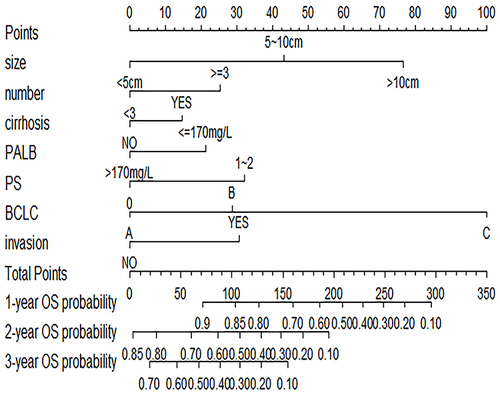
Figure 2 ROC curve and AUC of the nomogram to predict 1-, 2-, and 3-year OS in training cohort (A) and validation cohort (B).
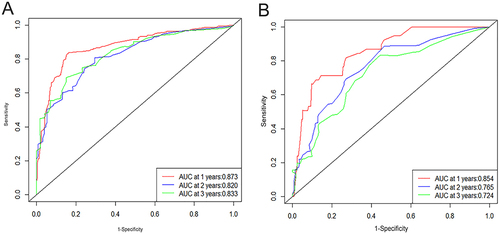
Figure 3 The calibration plots of the nomogram for 1-, 2-, and 3-year survival probabilities in training and validation cohort. (A) One-year OS of the training cohort. (B) Two-year OS of the training cohort. (C) Three-year OS of the training cohort. (D) One-year 0S of the validation cohort. (E) Two-year OS of the validation cohort. (F) Three-year OS of the validation cohort.
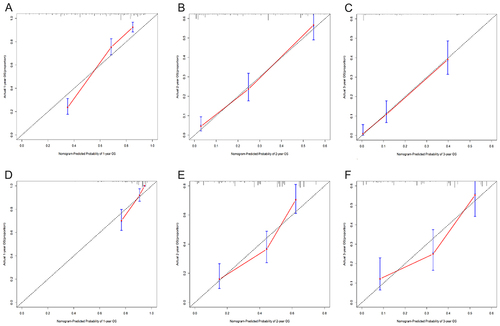
Figure 4 DCA for the nomogram predicting 1-, 2-, and 3-year OS in the training and validation cohorts. (A) One-year OS of the training cohort. (B) Two-year OS of the training cohort. (C) Three-year OS of the training cohort. (D) One-year 0S of the validation cohort. (E) Two-year OS of the validation cohort. (F) Three-year OS of the validation cohort.
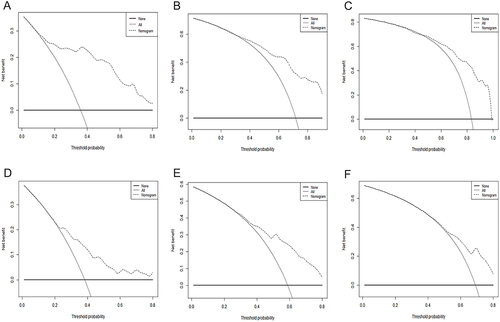
Figure 5 Kaplan-Meier curves of unresectable hepatocellular carcinoma patients in the low-risk and high-risk groups in training cohort (A) and validation cohort (B).
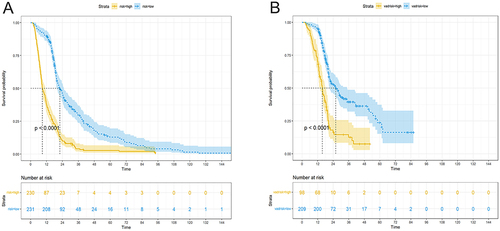
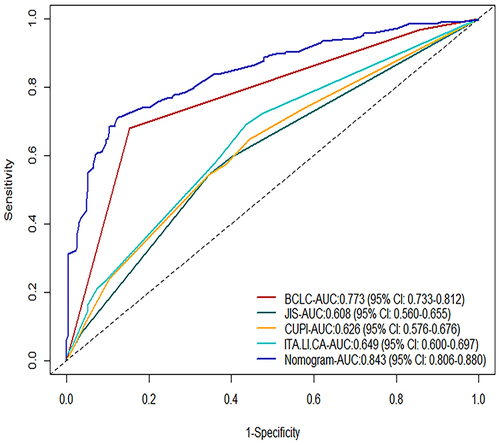
Figure 6 AUC and 95% CI of the Nomogram and Conventional Prognostic Staging Systems.